Loom - Part 2 - Blocking code
One of the biggest pain points I had learning about concurrent programming was the emphasis put on
Blocking, Non-blocking, Synchronous and Asynchronous code.
We’ll touch on all four in the next parts of this series.
Part 2 in a series of articles about Project Loom.
In this part we implement a proxy service, the easiest way possible.
The companion code repository is at arnaudbos/untangled
If you’d like you could head over to
Part 0 - Rationale
Part 1 - It’s all about Scheduling
Part 2 - Blocking code (this page)
Part 3 - Asynchronous code
Part 4 - Non-thread-blocking async I/O
Part 5 - Reactive Streams

Weaving
A simple use case
After reading a lot I figured that implementing a simple use case would comfort my understandings and help me convey what I wanted to explain. So here’s a not totally made up, simple use case:
- clients need access to some restricted resources,
- a proxying service will rate-limit the clients access, based on a token policy.
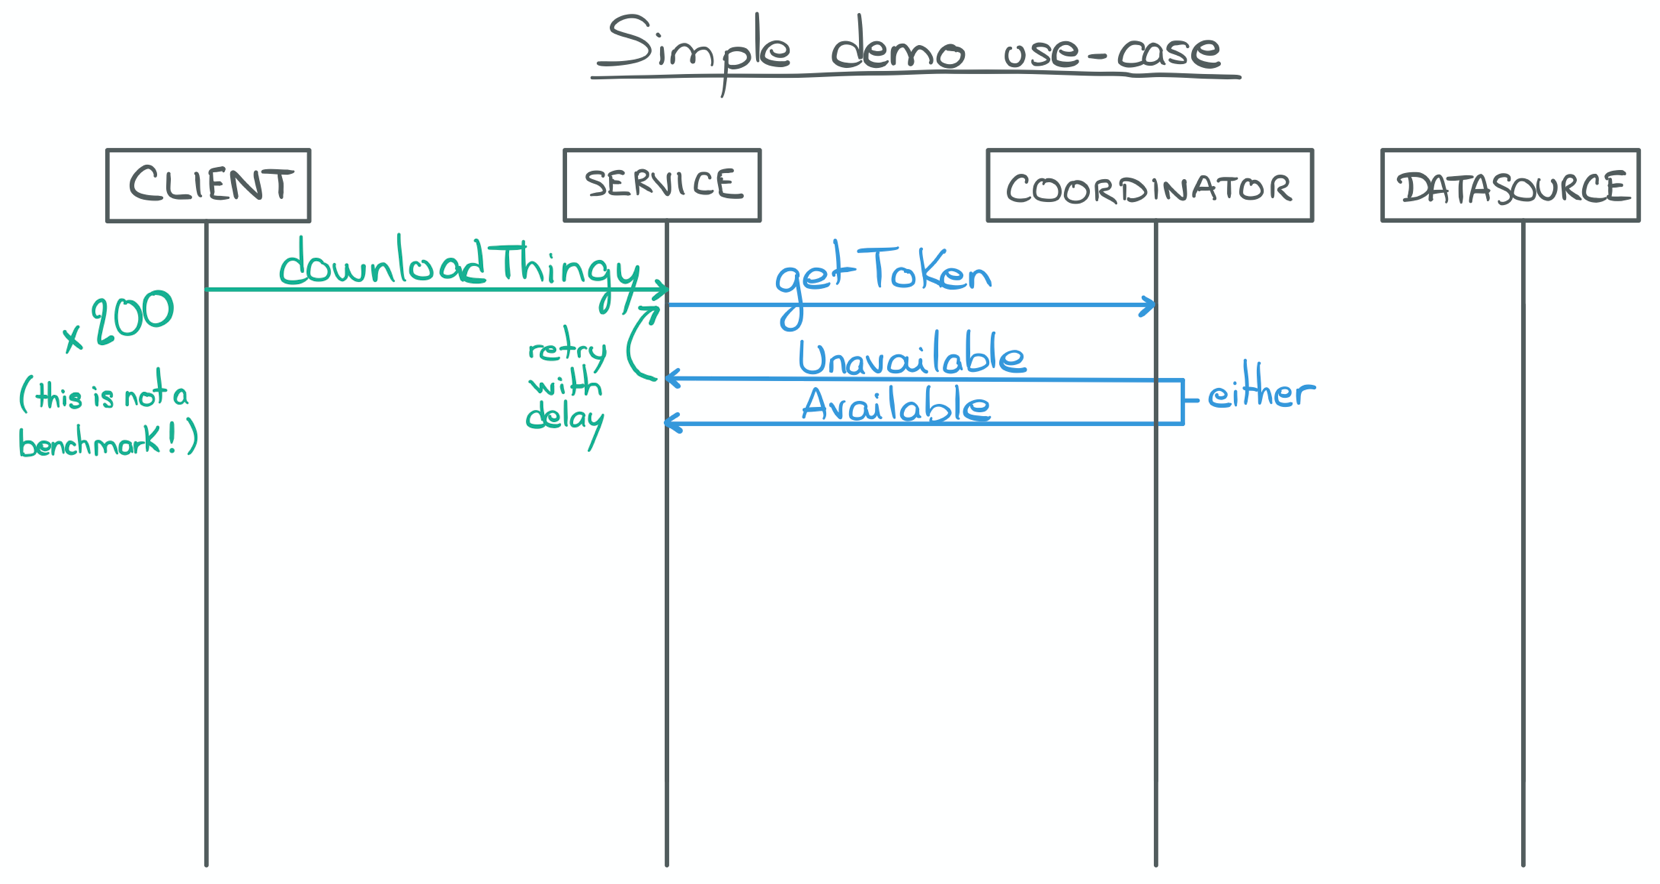
- A client addresses a download request to the proxy service.
- The proxy service registers the request to a coordinator.
- The coordinator is responsible for the scheduling logic using a priority queue. Its logic is irrelevant.
- The coordinator responds either “Unavailable” or “Available”.
- “Unavailable” means that the client can’t download the resource just yet (responses’ payload contains a token).
- The payload also contains an “ETA”, so the service can decide to abort or to retry, using the token to keep its place in the coordinator’s queue.
- The payload also contains a “wait” time to rate-limit the retry requests to the coordinator.
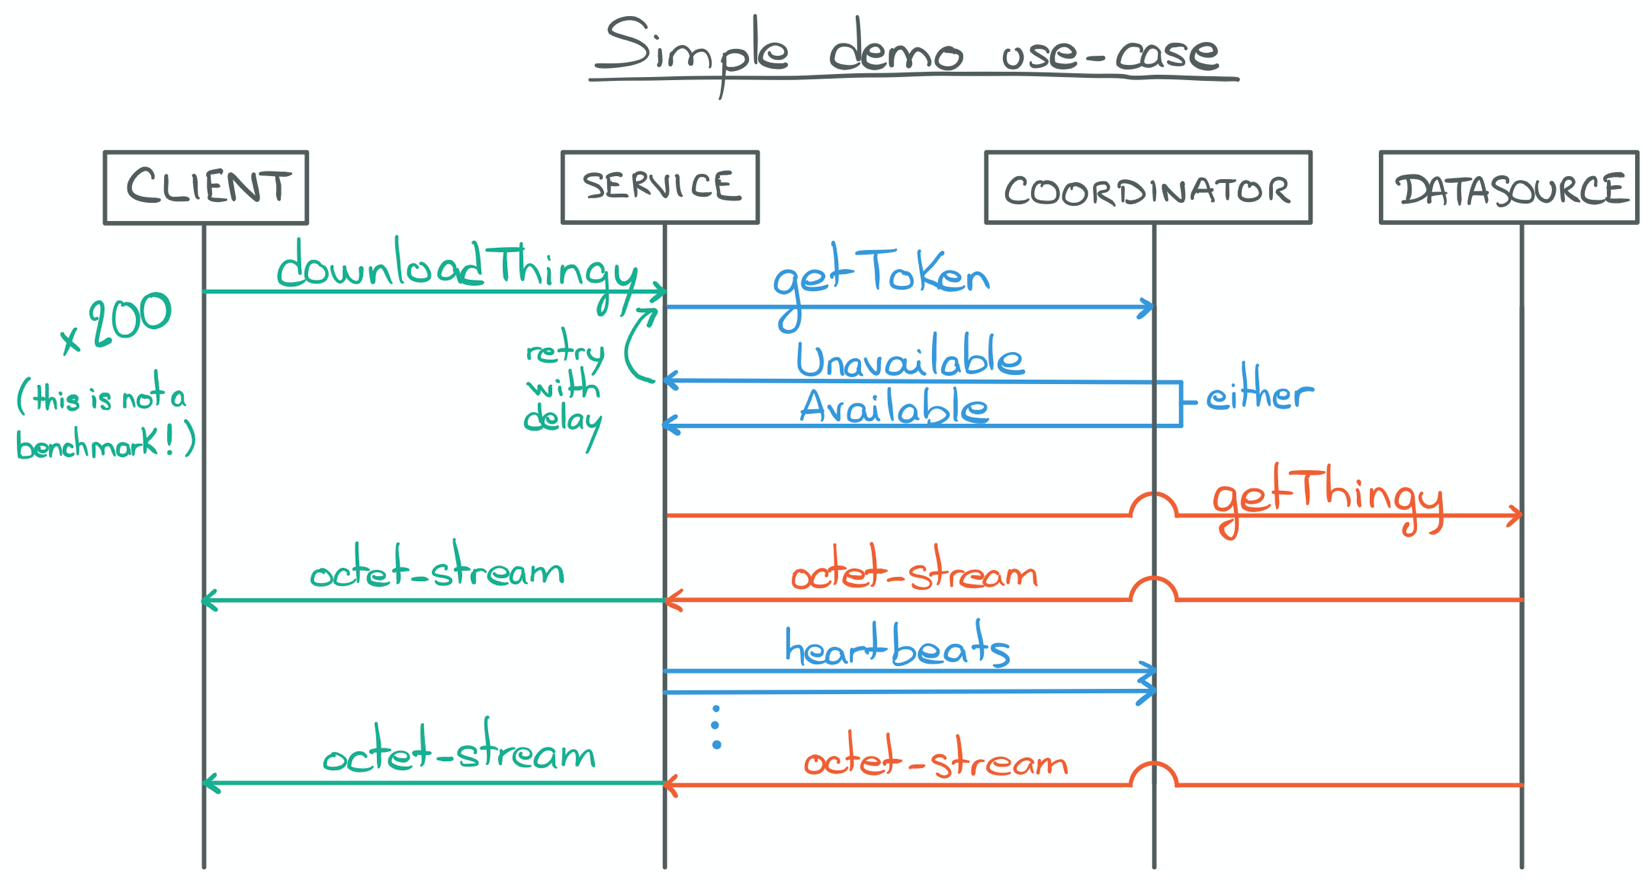
- The proxy may have to retry a couple of times, on behalf of the client, but will eventually receive an “Available” response.
- With an “Available” response and the token contained in its payload, the proxy service can initiate a download request to the data source.
- The proxy service streams the content of the download request back to its client;
- While at the same time sending periodic “heartbeat” requests to the coordinator to ensure its token is not revoked.
We are going to use this scenario in the next parts of the series. We will implement this proxy service in various ways, simulate a few (200) clients connecting simultaneously and see the pros and cons of each implementation.
Bear in mind that this is not a benchmark, it’s just an experiment! 200 clients is a really low number but is enough to observe a few interesting things.
First implementation
I am now going to show you the easiest way I came up with to implement this proxy service.
You can find the complete source code for this sample here.
getThingy() is the download endpoint in this example. Each client “connecting” to the proxy hits this method:
private void getThingy() throws EtaExceededException, IOException {
    println("Start getThingy.");

    try {
①      Connection.Available conn = getConnection();
        println("Got token, " + conn.getToken());

        Thread pulse = makePulse(conn);
②      try (InputStream content = gateway.downloadThingy()) {
③          pulse.start();

④          ignoreContent(content);
        } catch (IOException e) {
            err("Download failed.");
            throw e;
        }
        finally {
⑤          pulse.interrupt();
        }
    } catch (InterruptedException e) {
        // D'oh!
        err("Task interrupted.");
        Thread.currentThread().interrupt();
        throw new RuntimeException(e);
    }
    println("Download finished")
}- We retrieve an “Available” connection
connfrom the coordinator - We initiate the download request to the data source (called
gatewayin this example). - Once the download has begun we start the heartbeat requests (pulse thread).
- While at the same time consuming the content (
InputStream, here we simply drop it, but in a real scenario we would forward to the client). - Once the download ends (successfully or not) we stop sending heartbeat requests and the call ends.
Maybe you were hoping to see some kind of framework here, some @Controller or @GET annotation perhaps?
In this series, I’m not going to bother with a framework. Because the number of clients is so small and this is not a benchmark, I am just simulating the client calls from within the same JVM.
This way, I am able to use the kind of ExecutorService I want for each implementation, in order to outline a few
things. This executor and its thread pool will simulate the Web Server thread pool that could be found inside any Web
Framework. In the end it is more illustrative to have it directly at hand.
Let’s simulate a few clients, shall we?
CompletableFuture<Void>[] futures = new CompletableFuture[MAX_CLIENTS];
for(int i=0; i<MAX_CLIENTS; i++) {
    int finalI = i;
    futures[i] = new CompletableFuture<>();
    elasticServiceExecutor.submit(() -> {
        try {
            getThingy(finalI);
            futures[finalI].complete(null);
        } catch (EtaExceededException e) {
            err("Couldn't getThingy because ETA exceeded: " + e);
            futures[finalI].completeExceptionally(e);
        } catch (Exception e) {
            err("Couldn't getThingy because something failed: " + e);
            futures[finalI].completeExceptionally(e);
        }
    });
}
In this implementation, elasticServiceExecutor is a “cached” ThreadPoolExecutor, and I will explain why in a
little bit.
elasticServiceExecutor =
    Executors.newCachedThreadPool(new PrefixedThreadFactory("service"));
We have a “Web Server”, clients and our download controller.
There are a few things to unpack from this controller.
Let’s start with the least interesting bit first, makePulse:
private Thread makePulse(Connection.Available conn) {
    return new Thread(() -> {
        while(!Thread.currentThread().isInterrupted()) {
            try {
                // Periodic heartbeat
                Thread.sleep(2_000L);

                println("Pulse!");
                coordinator.heartbeat(conn.getToken());
            } catch (InterruptedException e) {
                // D'oh!
                Thread.currentThread().interrupt();
            }
        }
    });
}
Nothing fancy here: sleep for a while, send a request, sleep for a while, send a request, …
You may have noticed that getThingy uses the gateway service to talk to the data source and that makePulse uses
the coordinator service to talk to the coordinator.
So what is this getConnection method and why does getThingy not use coordinator directly?
Because of the retry logic we’ve talked about before!
getConnection is actually a helper to handle
the Unavailable responses from the coordinator and only return when an Available response has been received. Here’s
the code:
private Connection.Available getConnection()
    throws EtaExceededException, InterruptedException
{
①  return getConnection(0, 0, null);
}

private Connection.Available getConnection(long eta, long wait, String token)
    throws EtaExceededException, InterruptedException
{
    for(;;) {
        if (eta > MAX_ETA_MS) {
            throw new EtaExceededException();
        }

        if (wait > 0) {
            Thread.sleep(wait);
        }

        println("Retrying download after " + wait + "ms wait.");

②      Connection c = coordinator.requestConnection(token);
        if (c instanceof Connection.Available) {
④          return (Connection.Available) c;
        }
③      Connection.Unavailable unavail = (Connection.Unavailable) c;
        eta = unavail.getEta();
        wait = unavail.getWait();
        token = unavail.getToken();
    }
}- We start with initial
etaandwaittimes at zero and no token (null). - We try to get a grant from the coordinator.
- If the coordinator rejects us with an
Unavailableresponse, we update the eta, wait and token and loop; - Otherwise we can return the
Availableresponse.
As I said: the easiest implementation I could come up with.
Any Java developer from junior to expert can understand this code!
It is classic, old, boring, imperative Java code which does the job.
And easy is important, right? I’m 100% confident that all of you know what the service does and how it does it. We can now build from here with all the subsequent implementations, using different paradigms and APIs.
Before that, let’s now see what this code actually does.
Profiling
The first tool I turned to is VisualVM. In the absence of metrics from the code, defaulting to VisualVM gives a basic understanding of the behaviour of a JVM application regarding its thread and objects allocation, CPU utilization, GC pressure, etc.
CPU usage
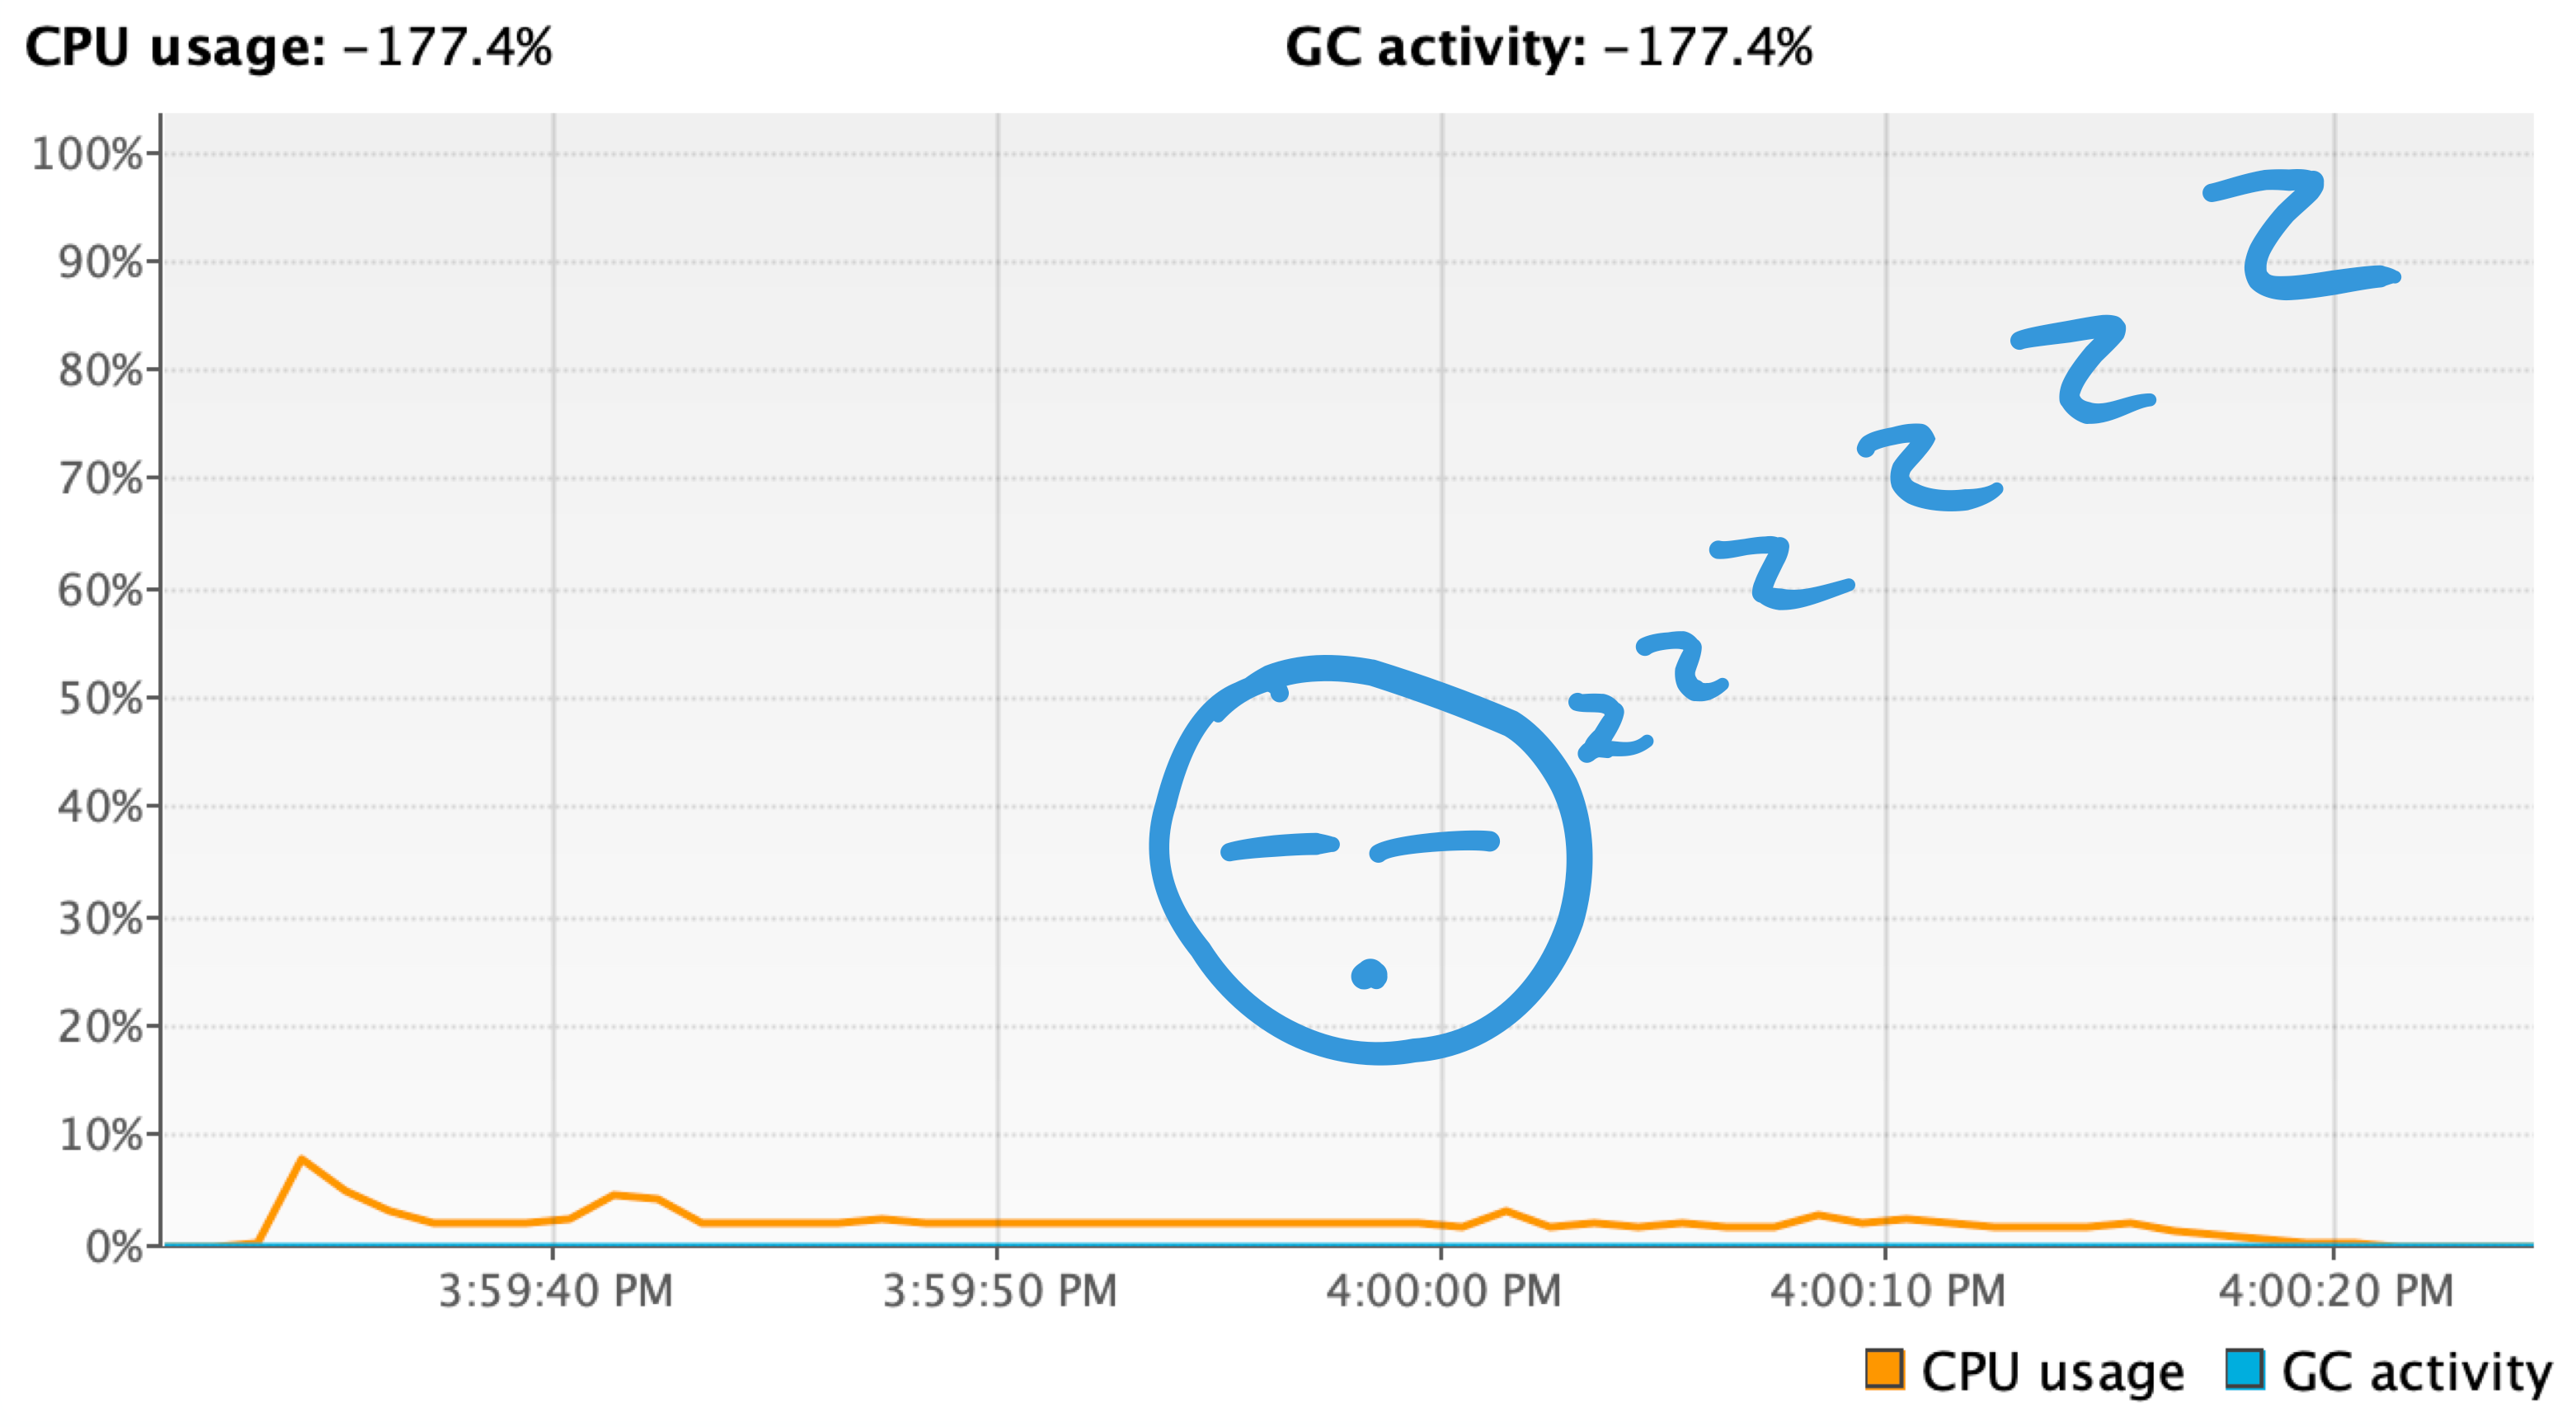
CPU usage is really limited in this example (at a guess, I’d say the 95 percentile is less than 3% with an outlier at about 8% for a very short time during startup). Which makes sense, right?
Indeed, this use case is designed to be I/O bound: it’s not like we’re computing any math. Instead we send a bunch or requests, wait a little in between, then some more requests to forward content from buffers and… Done.
None of this requires a lot of CPU power so this screenshot should not be surprising. In fact, it will be the same for all the other implementations we will see in the next parts, so I am not going to display it again.
Looking at the threads is much more interesting.
Threads
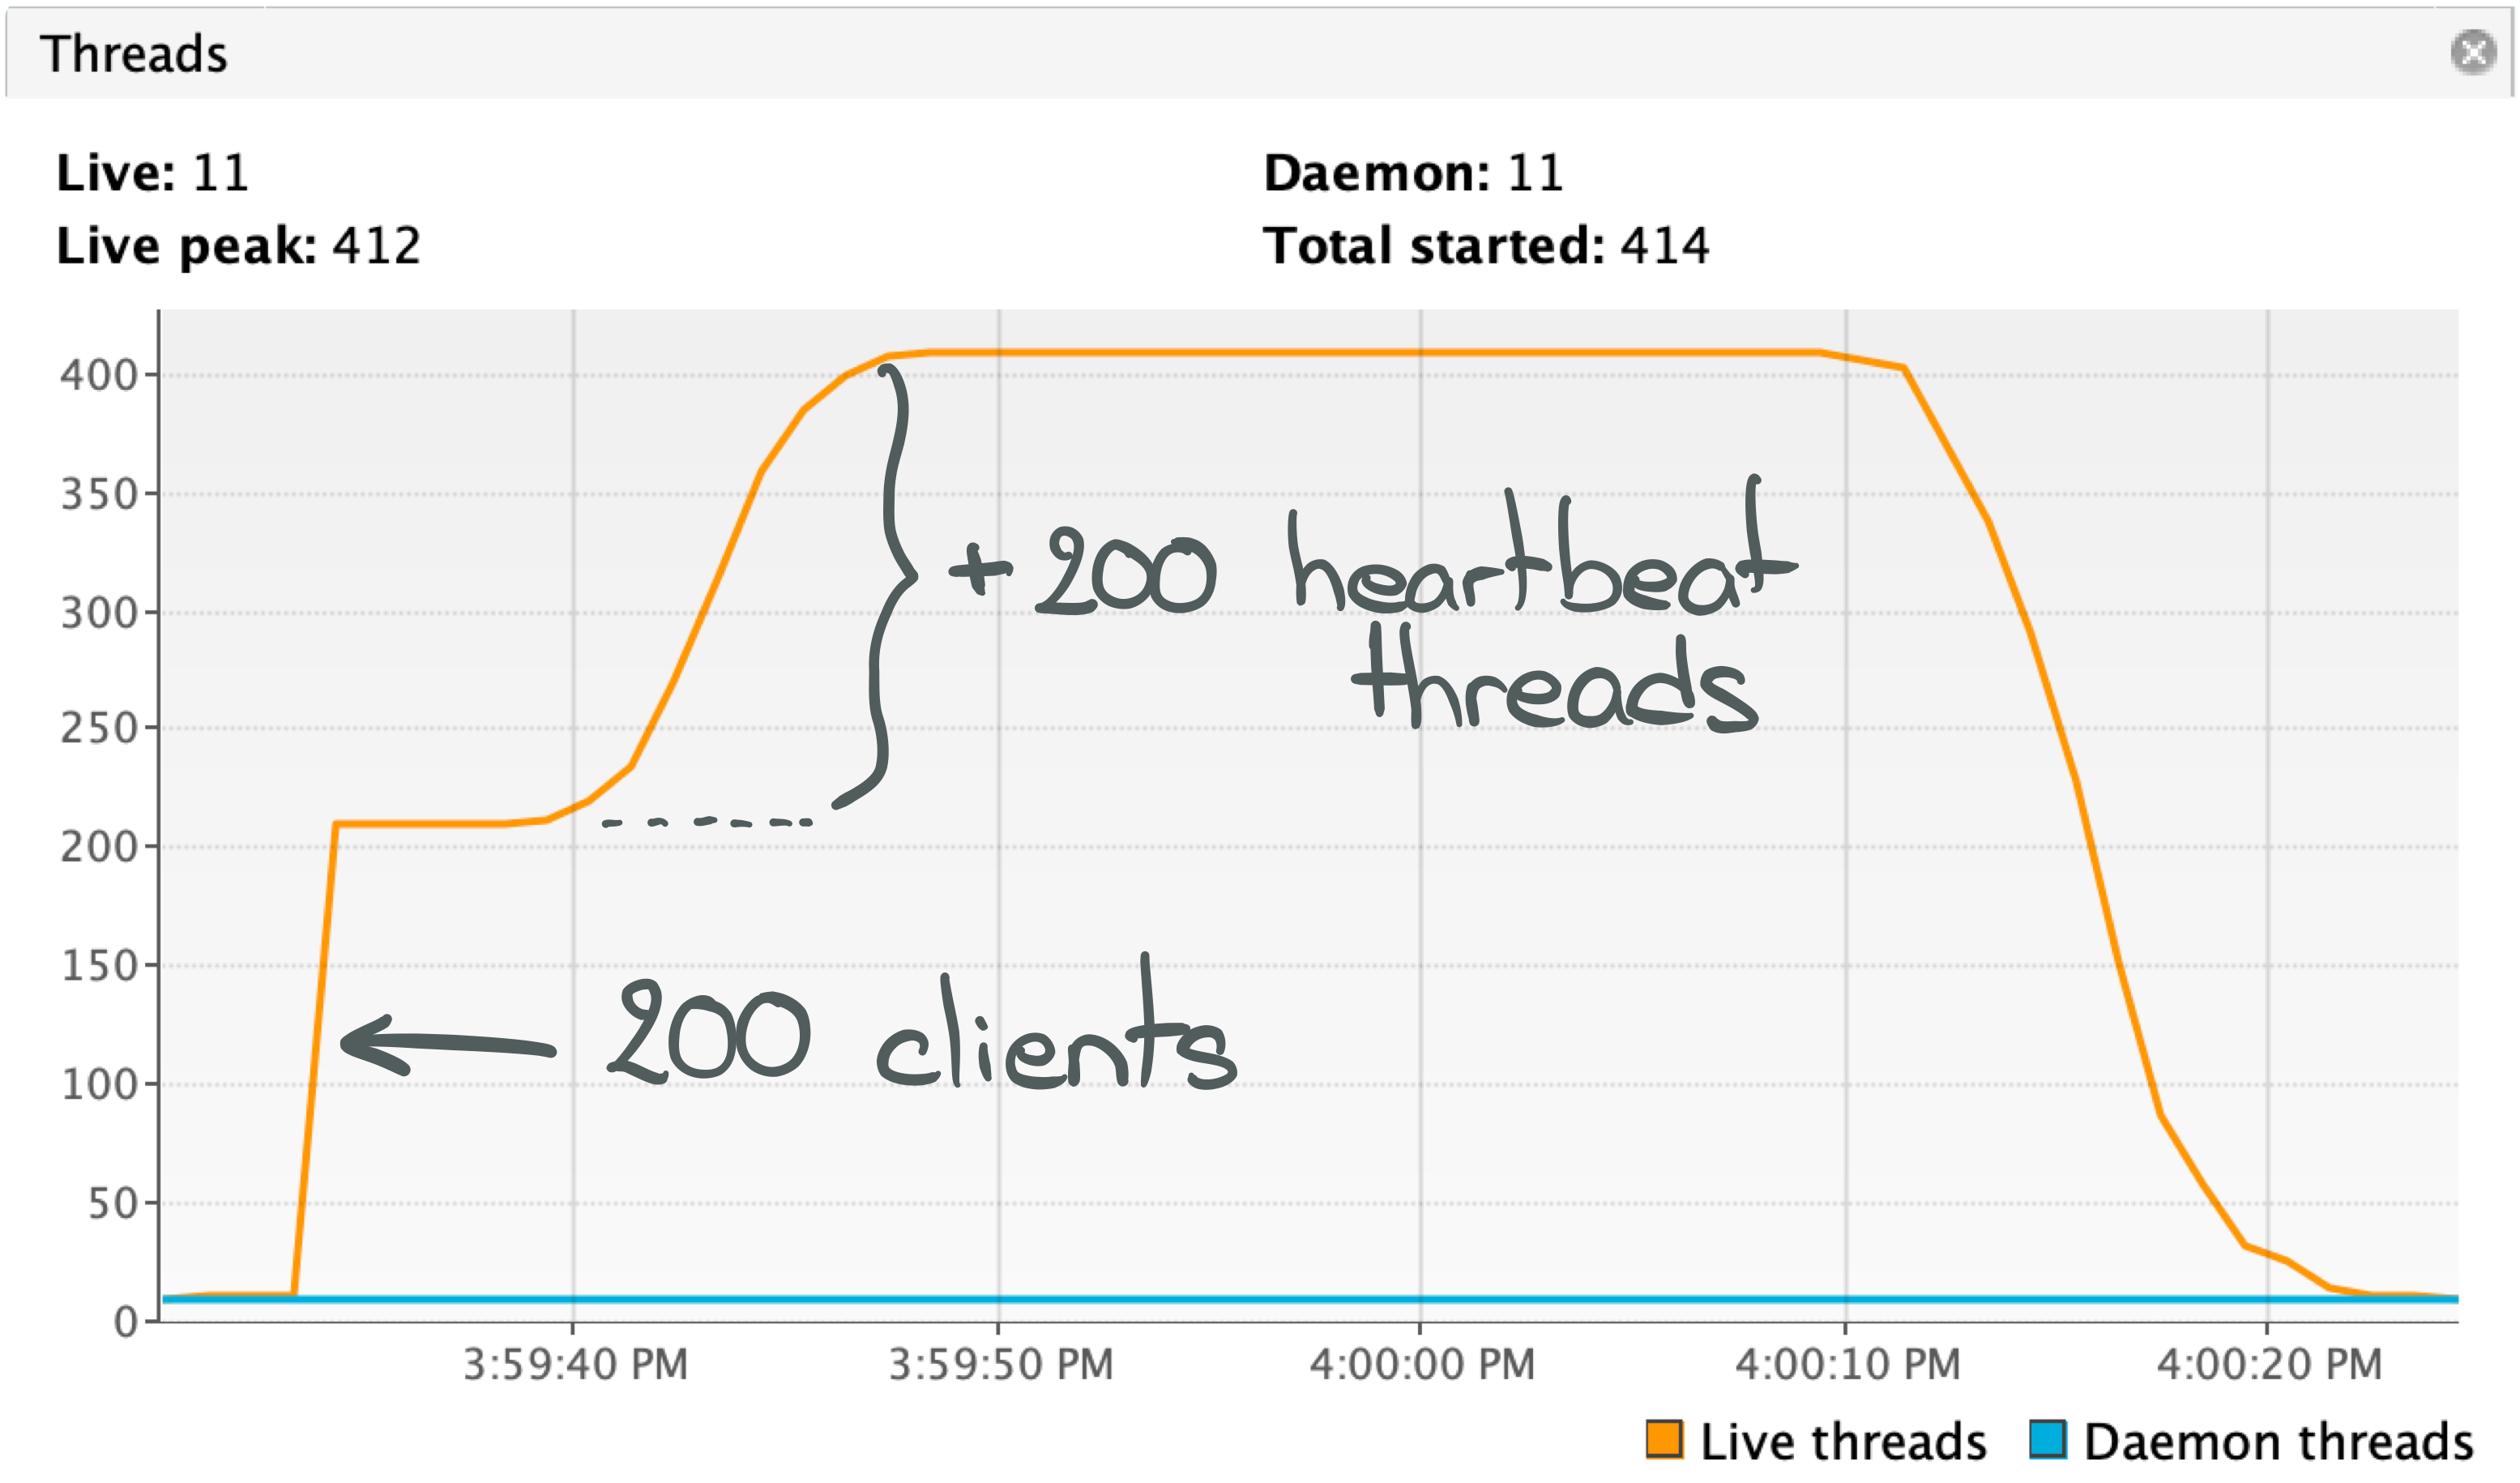
We can see in the figure above that when the application starts, meaning “when our clients connect”, it is going to create a first batch of about 200 threads. And then progressively start 200 more over a period of about 5 seconds.
The last 200 are pretty obvious given the implementation of makePulse: once the proxy begins to receive Available
responses from the coordinator, it starts the threads instantiated by the calls to makePulse. This is just an
implementation detail. A wrong one for sure, but a minor detail.
What should be more intriguing are the first 200 (the 10 additional ones are created by the JVM itself). Why are 200 clients creating 200 threads?
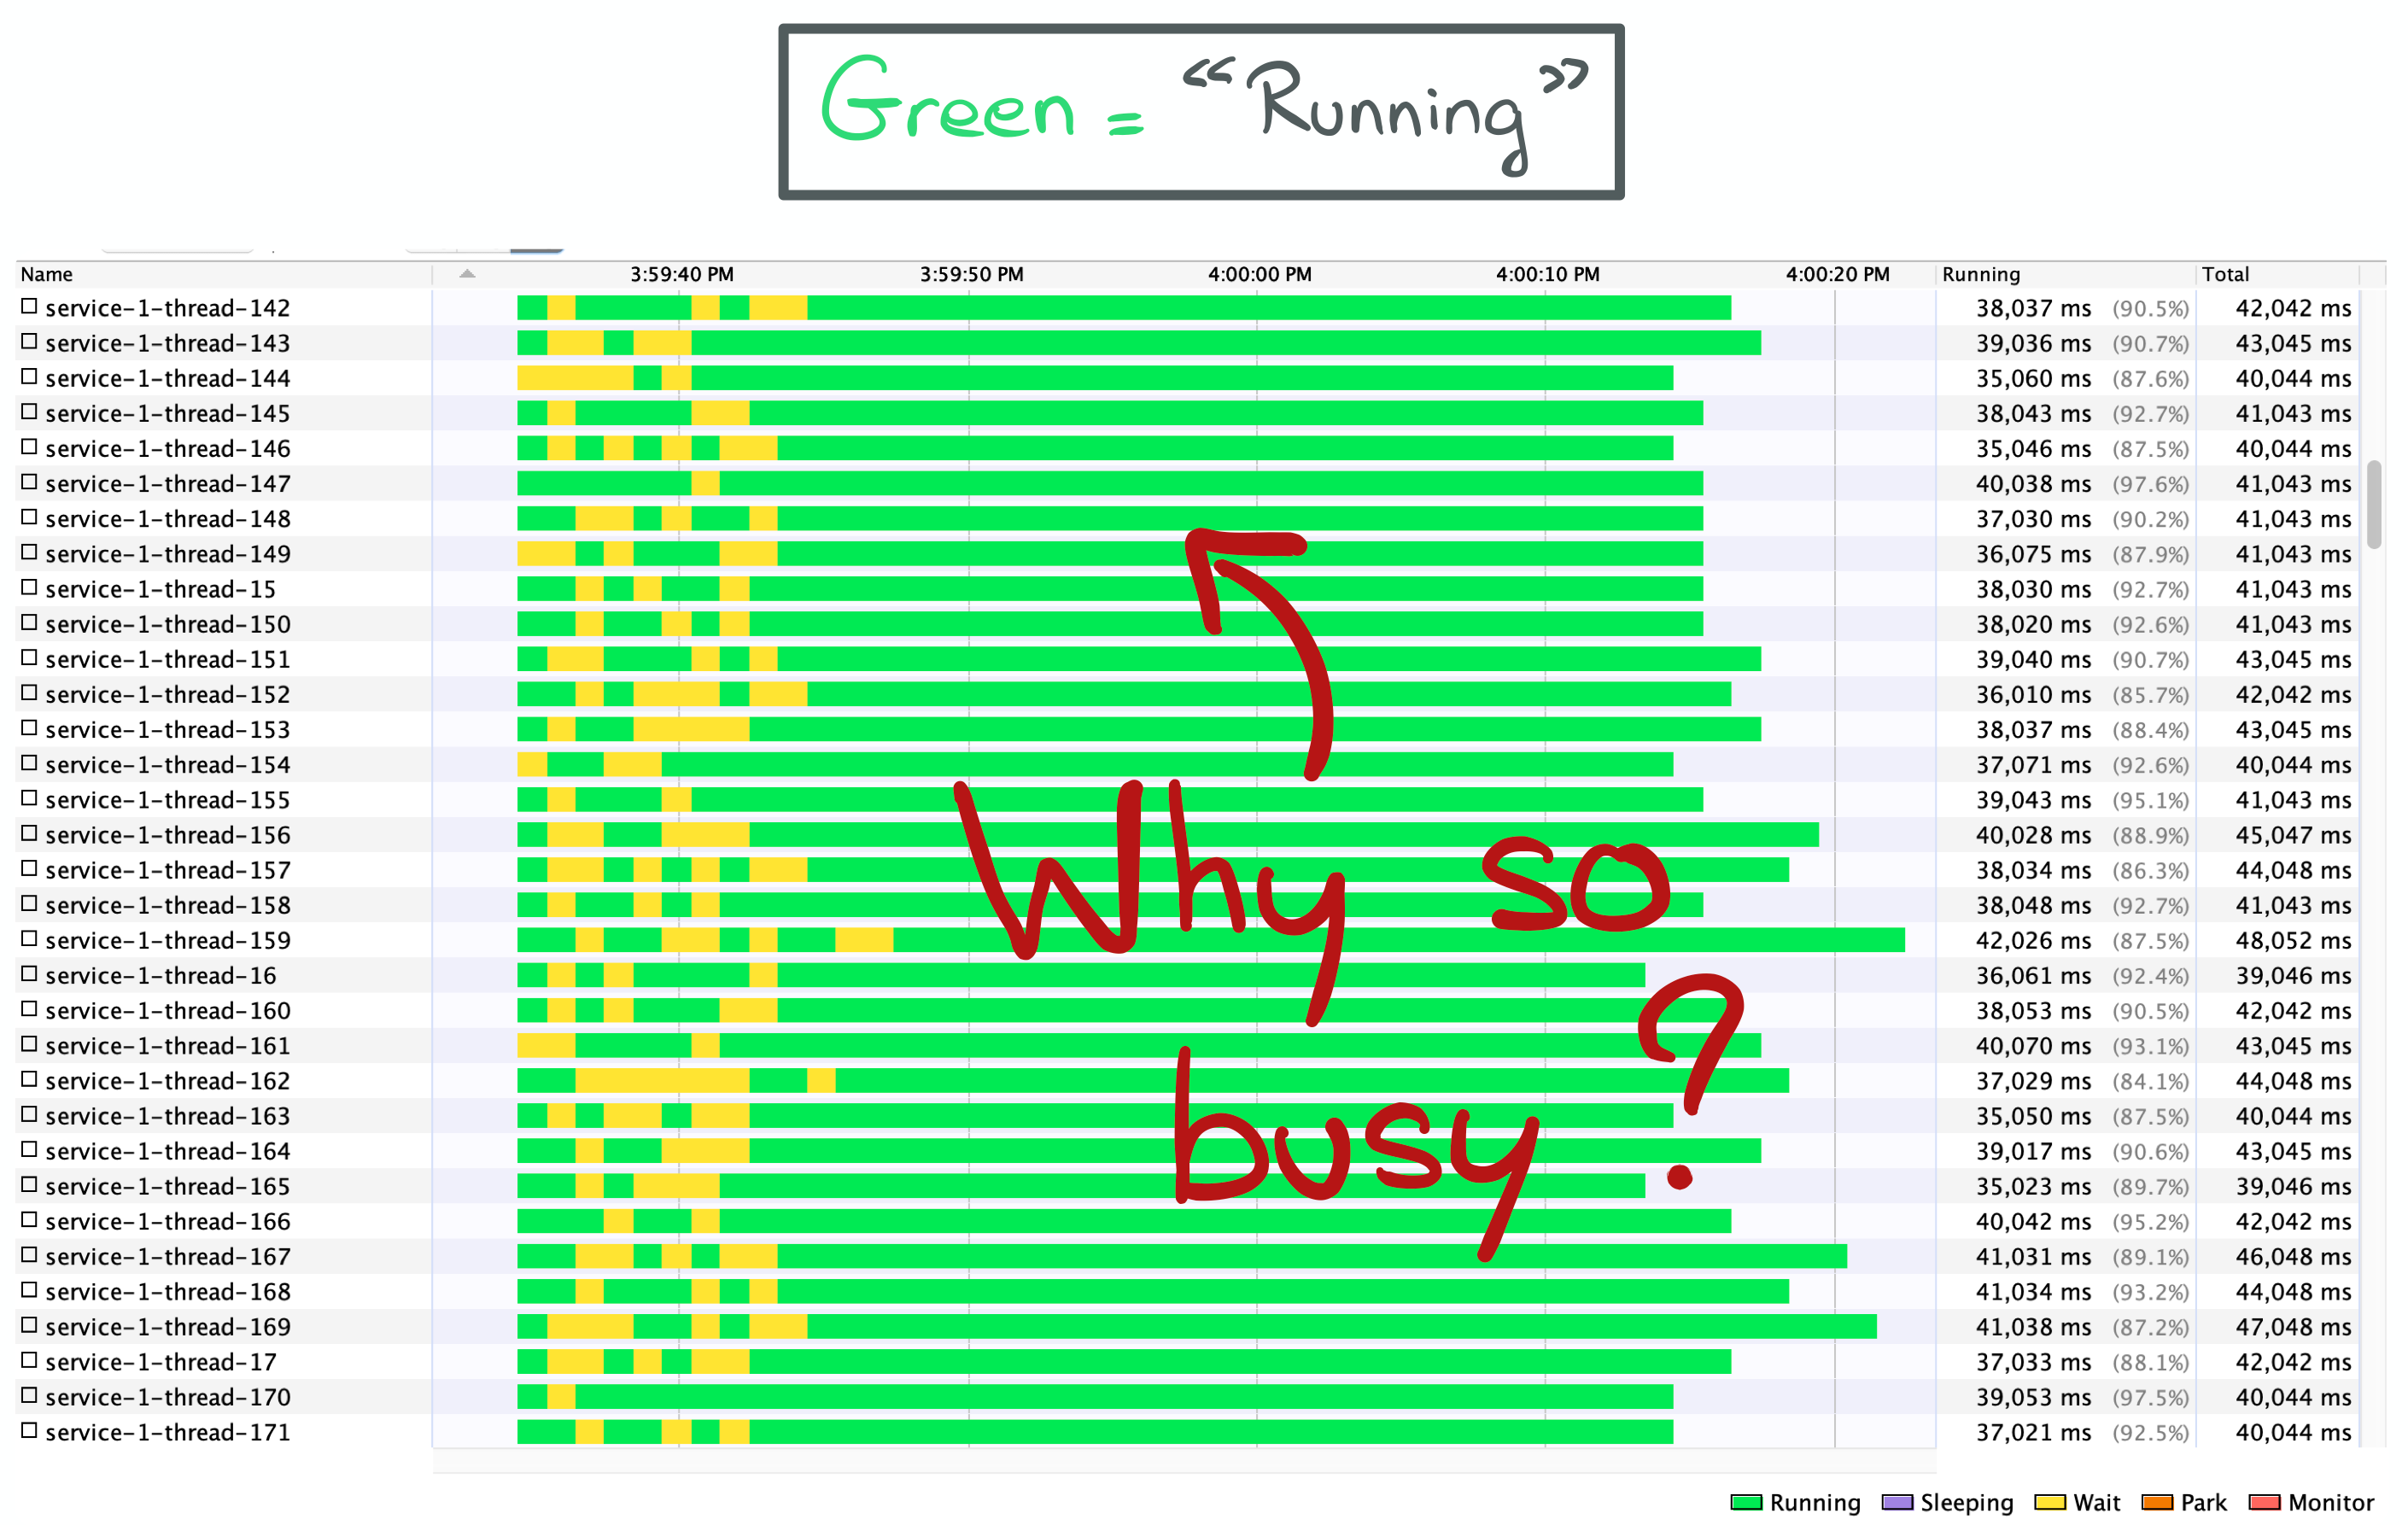
They all seem pretty busy (green means “running” in VisualVM), which is weird. We’ve seen that CPU usage is really low, so our cores don’t actually do much in practice!
We must take a closer look at what those threads actually do. Let’s get a thread dump.
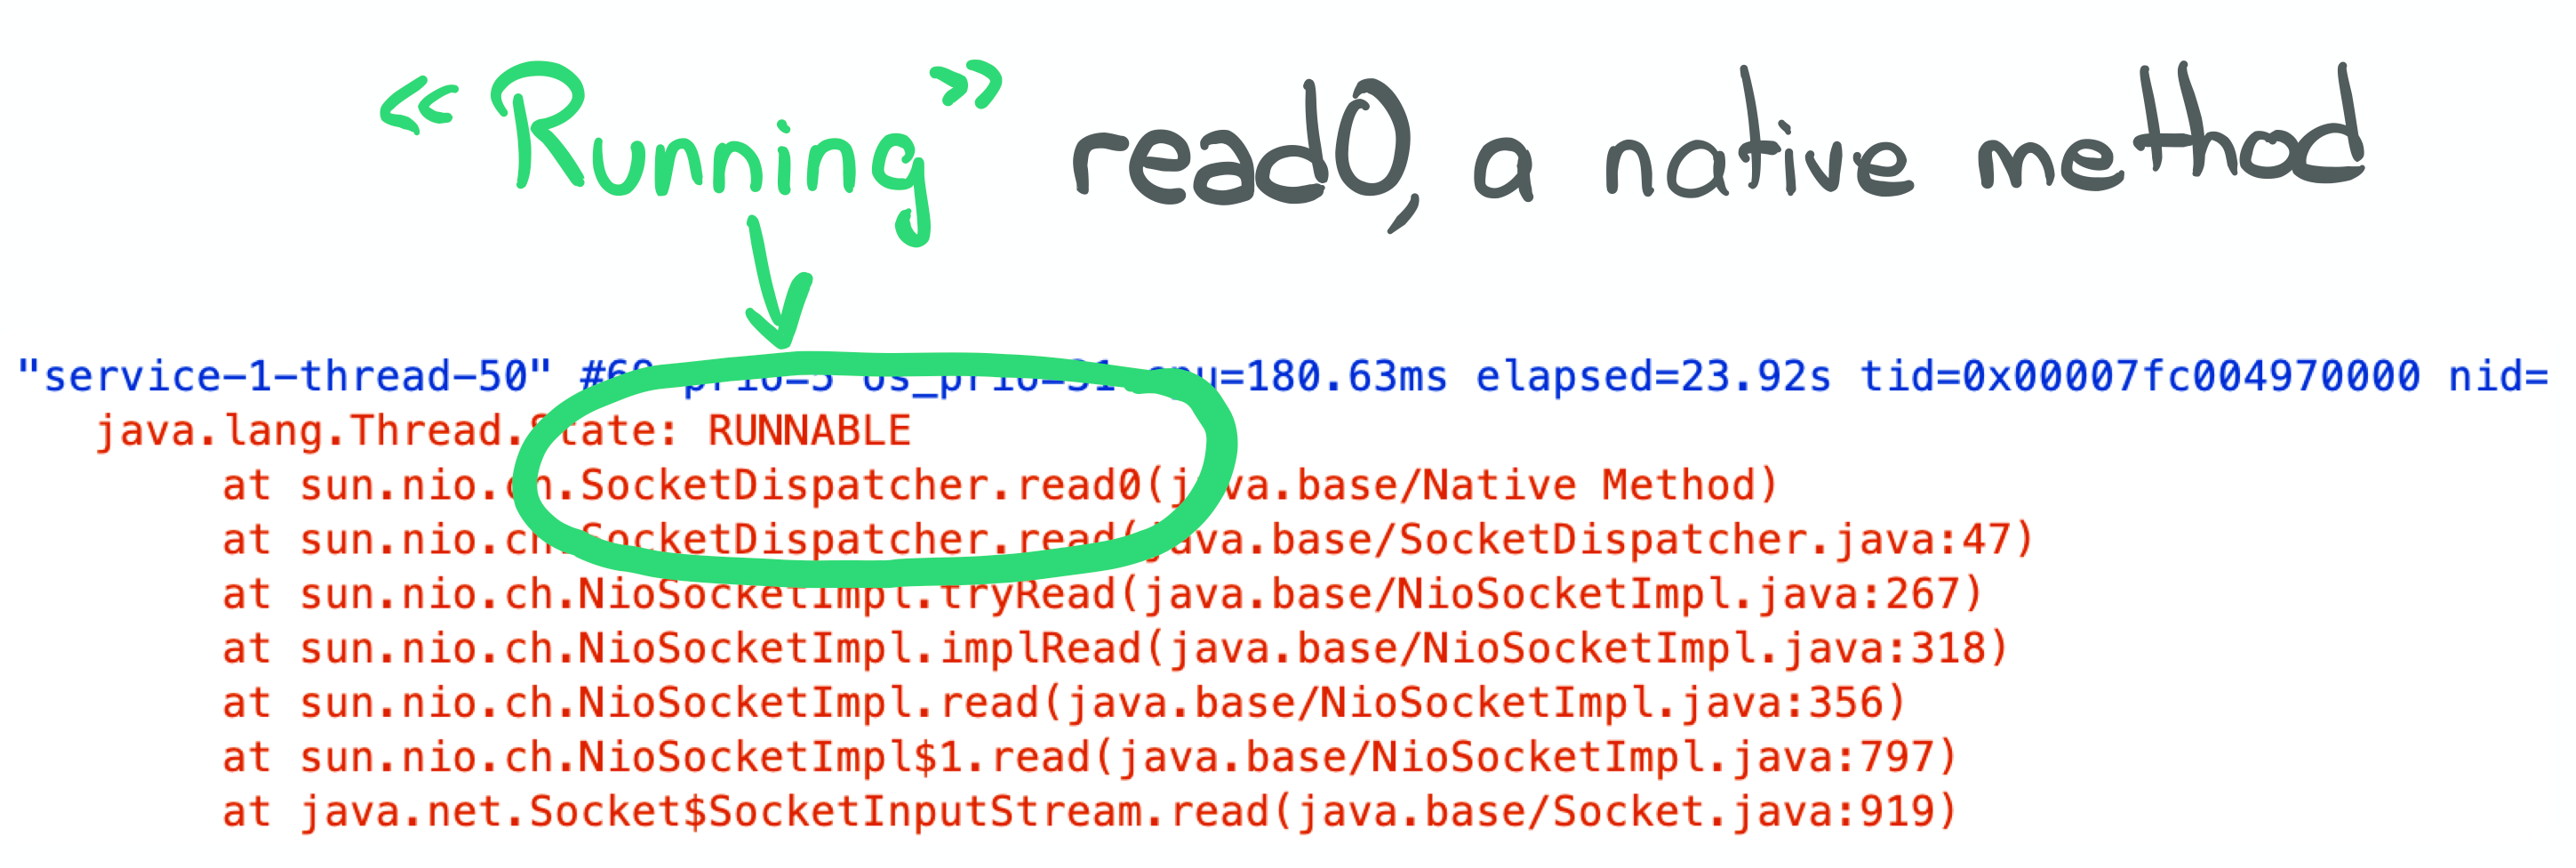
This screenshot shows only one of the many threads described in the thread dump because they all look alike.
The typical thread in this application seems to be running this SocketDispatch#read0 native method. And they aren’t
“just” running this method but in fact spending most of their time running it.
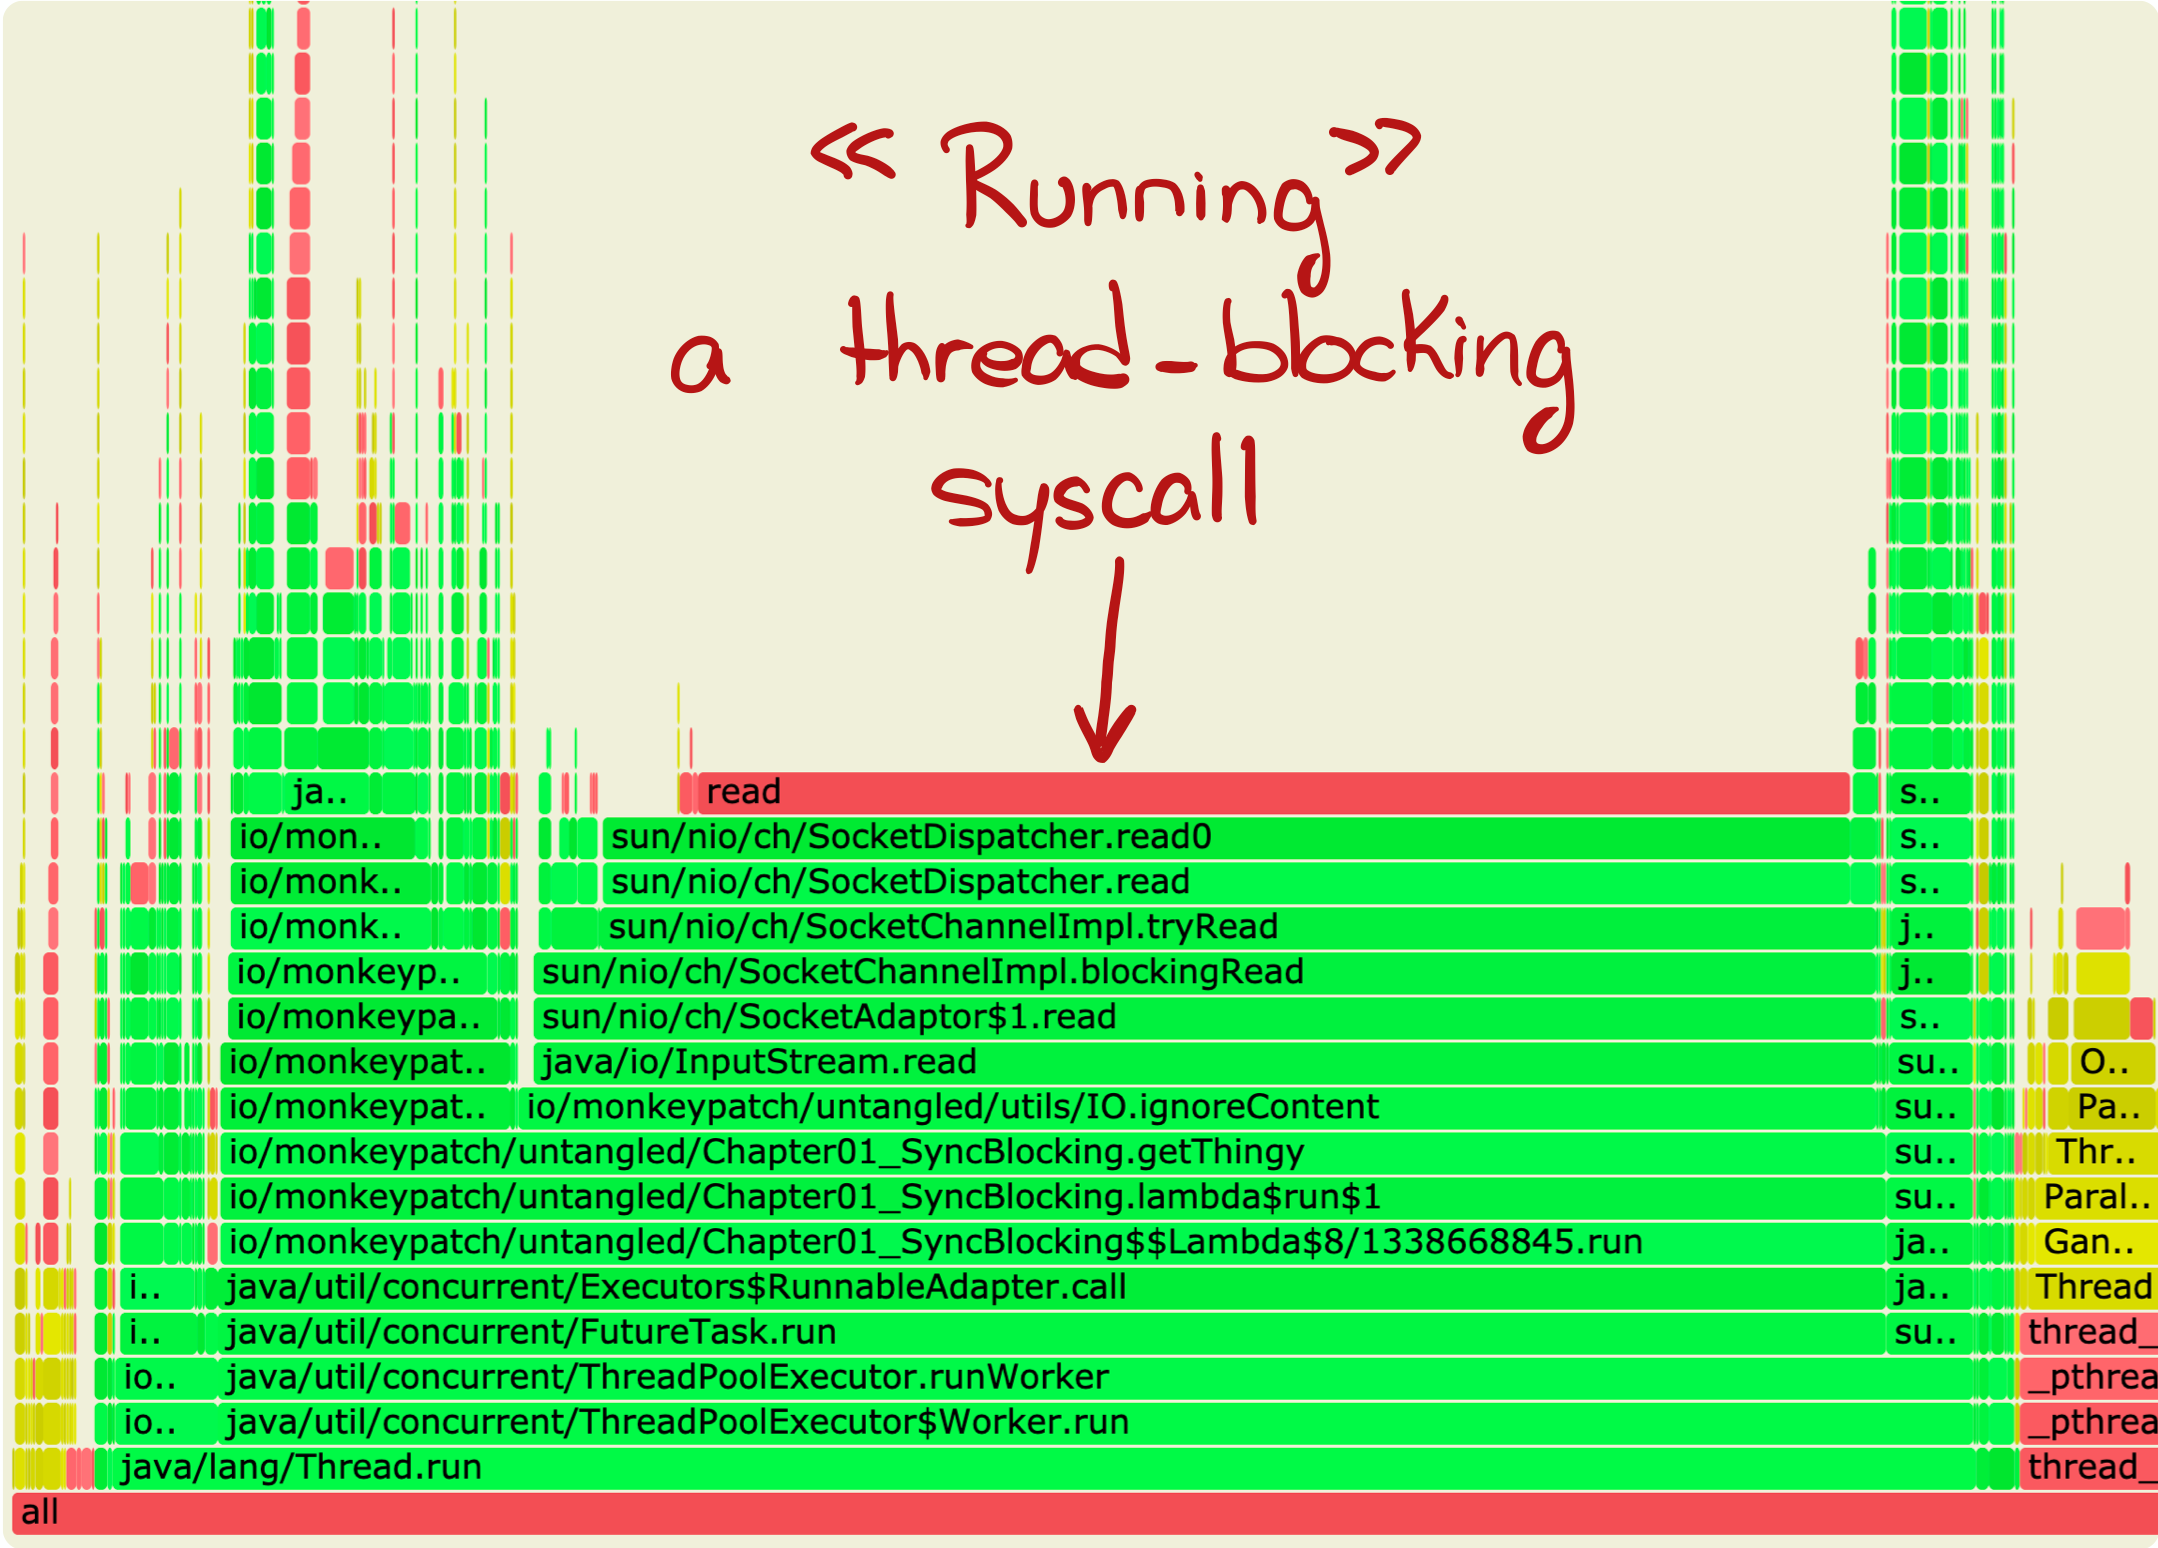
This flame graph was acquired using async-profiler and shows that time spent running SocketDispatcher#read0’s
underlying read system call dominates our application.
If we track its call stack to find its origin, we stumble upon lambda$run$1. Which, in fact, is the call to the
astutely named blockingRequest method, inside of the gateway service:
class SyncGatewayService {
    InputStream downloadThingy() throws IOException {
        return blockingRequest(
            "http://localhost:7000",
            String.format(HEADERS_TEMPLATE,
                          "GET",
                          "download",
                          "text/*",
                          String.valueOf(0))
        );
    }
}
Without further suspense, here’s its code:
public static InputStream blockingRequest(String url, String headers)
    throws IOException
{
    println("Starting request to " + url);
    URL uri = new URL(url);
    SocketAddress serverAddress =
        new InetSocketAddress(uri.getHost(), uri.getPort());
    SocketChannel channel = SocketChannel.open(serverAddress);
    ByteBuffer buffer = ByteBuffer.wrap(
        (headers + "Host: " + uri.getHost() + "\r\n\r\n").getBytes()
    );
    do {
        channel.write(buffer);
    } while(buffer.hasRemaining());

    return channel.socket().getInputStream();
}
You can see in the call chain that read0 originates from calling InputStream#read. The InputStream itself is
obtained from the SocketChannel. And this, dear reader, is the ugly detail that makes this application not
efficient and is the reason why we end up with as many threads as clients.
Because this socket channel (analogous to a file descriptor) is written to and read from in blocking mode.
What’s a blocking call and why is it bad?
Let’s talk about what happens when one of our threads’ runnable contains a thread blocking call.
Context switches
What they are
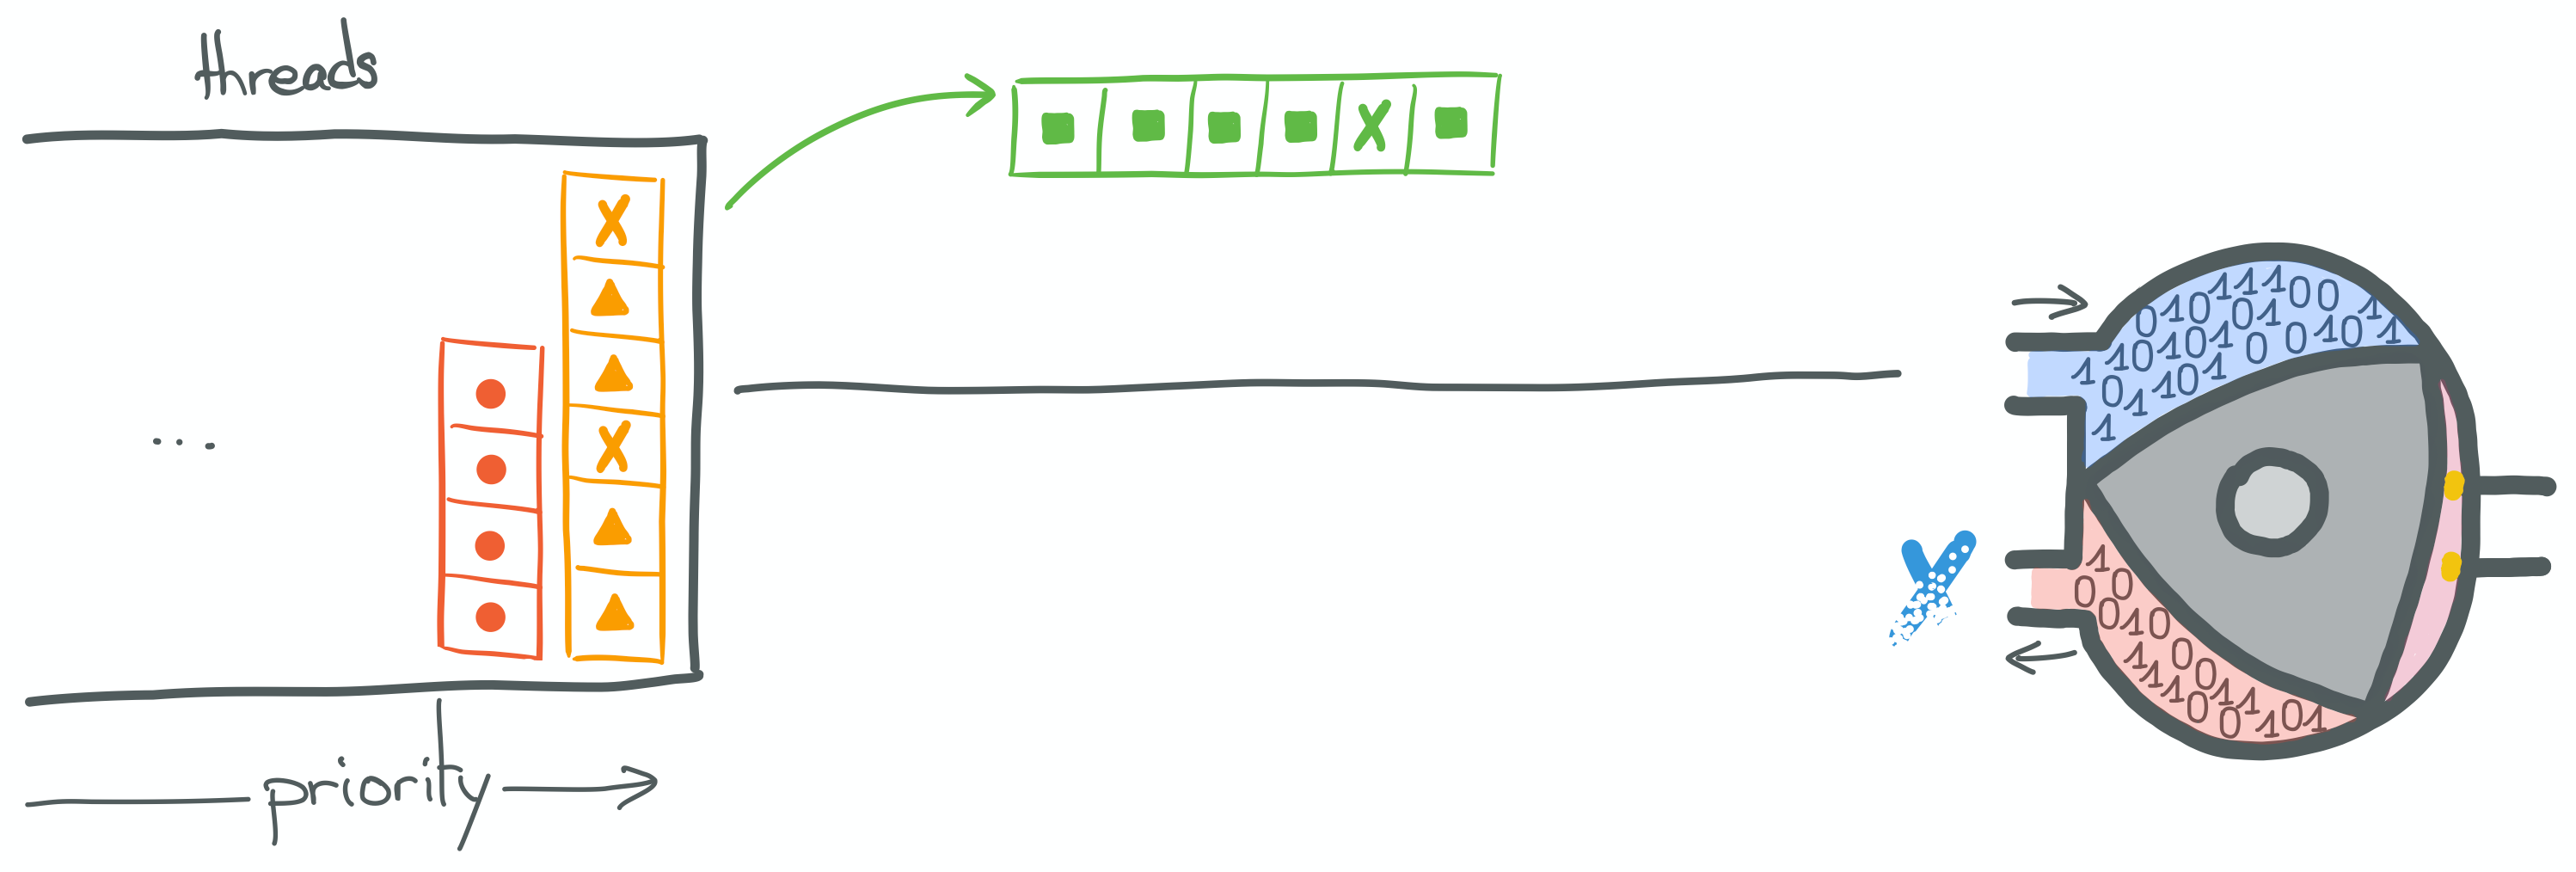
For the sake of simplicity, let’s assume that our CPUs run two kinds of instructions.
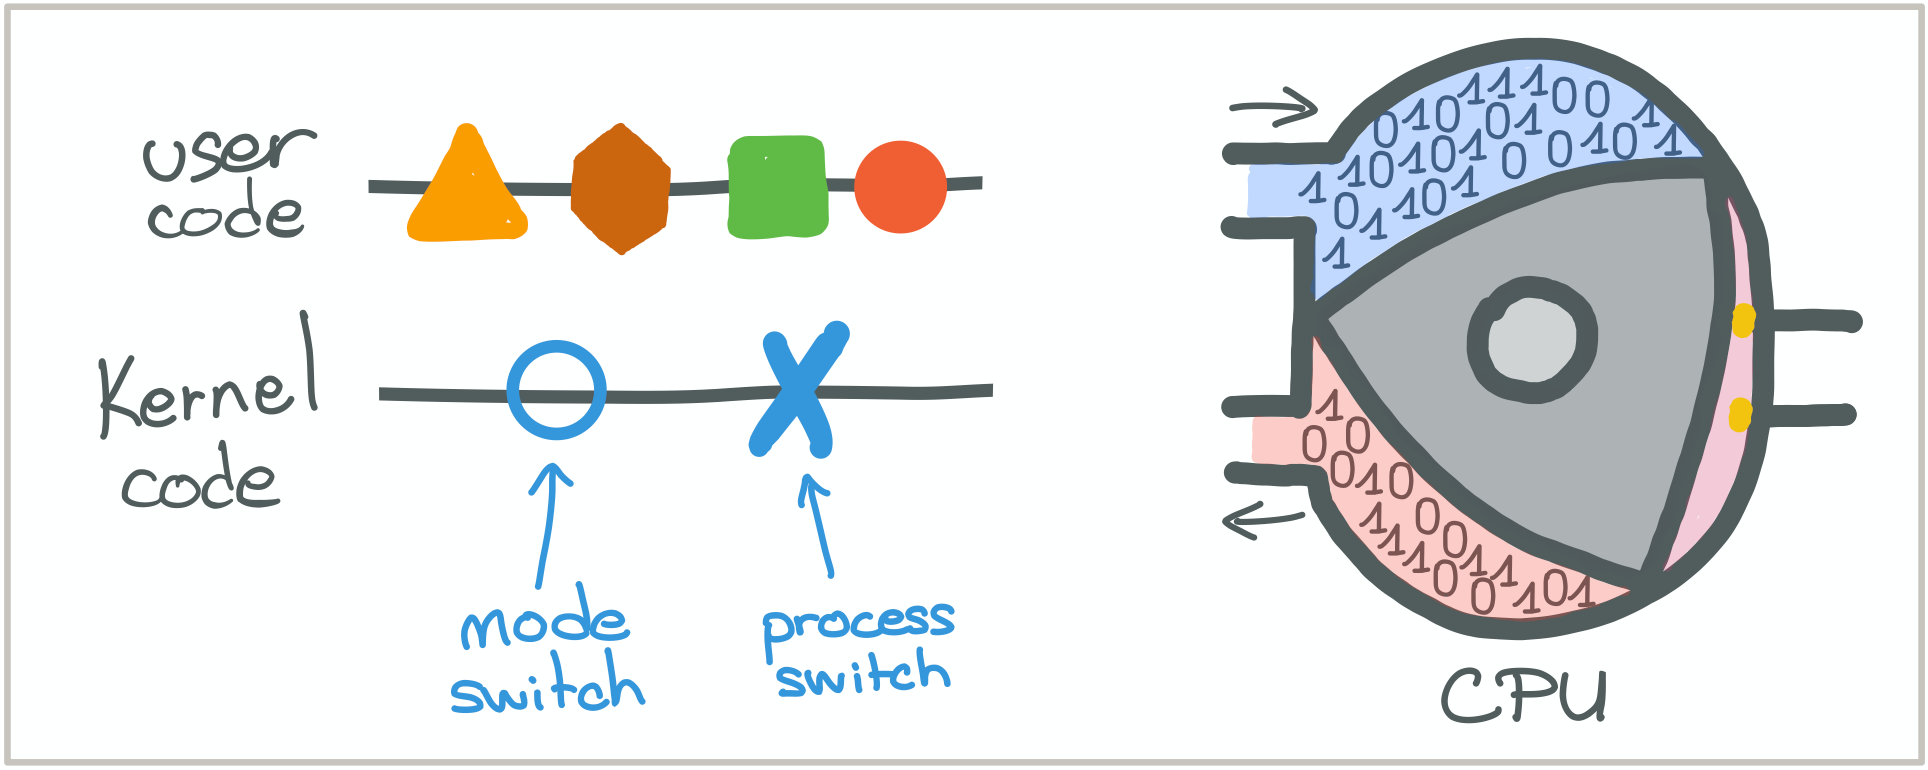
Instructions coming from what we’ll call our “user code”, represented by the triangle, hexagon, square and round shapes.
And instructions coming from the kernel whose goals are to enforce scheduling policies represented by the circle and
cross shapes.
The CPU will be represented by a Wankel engine.
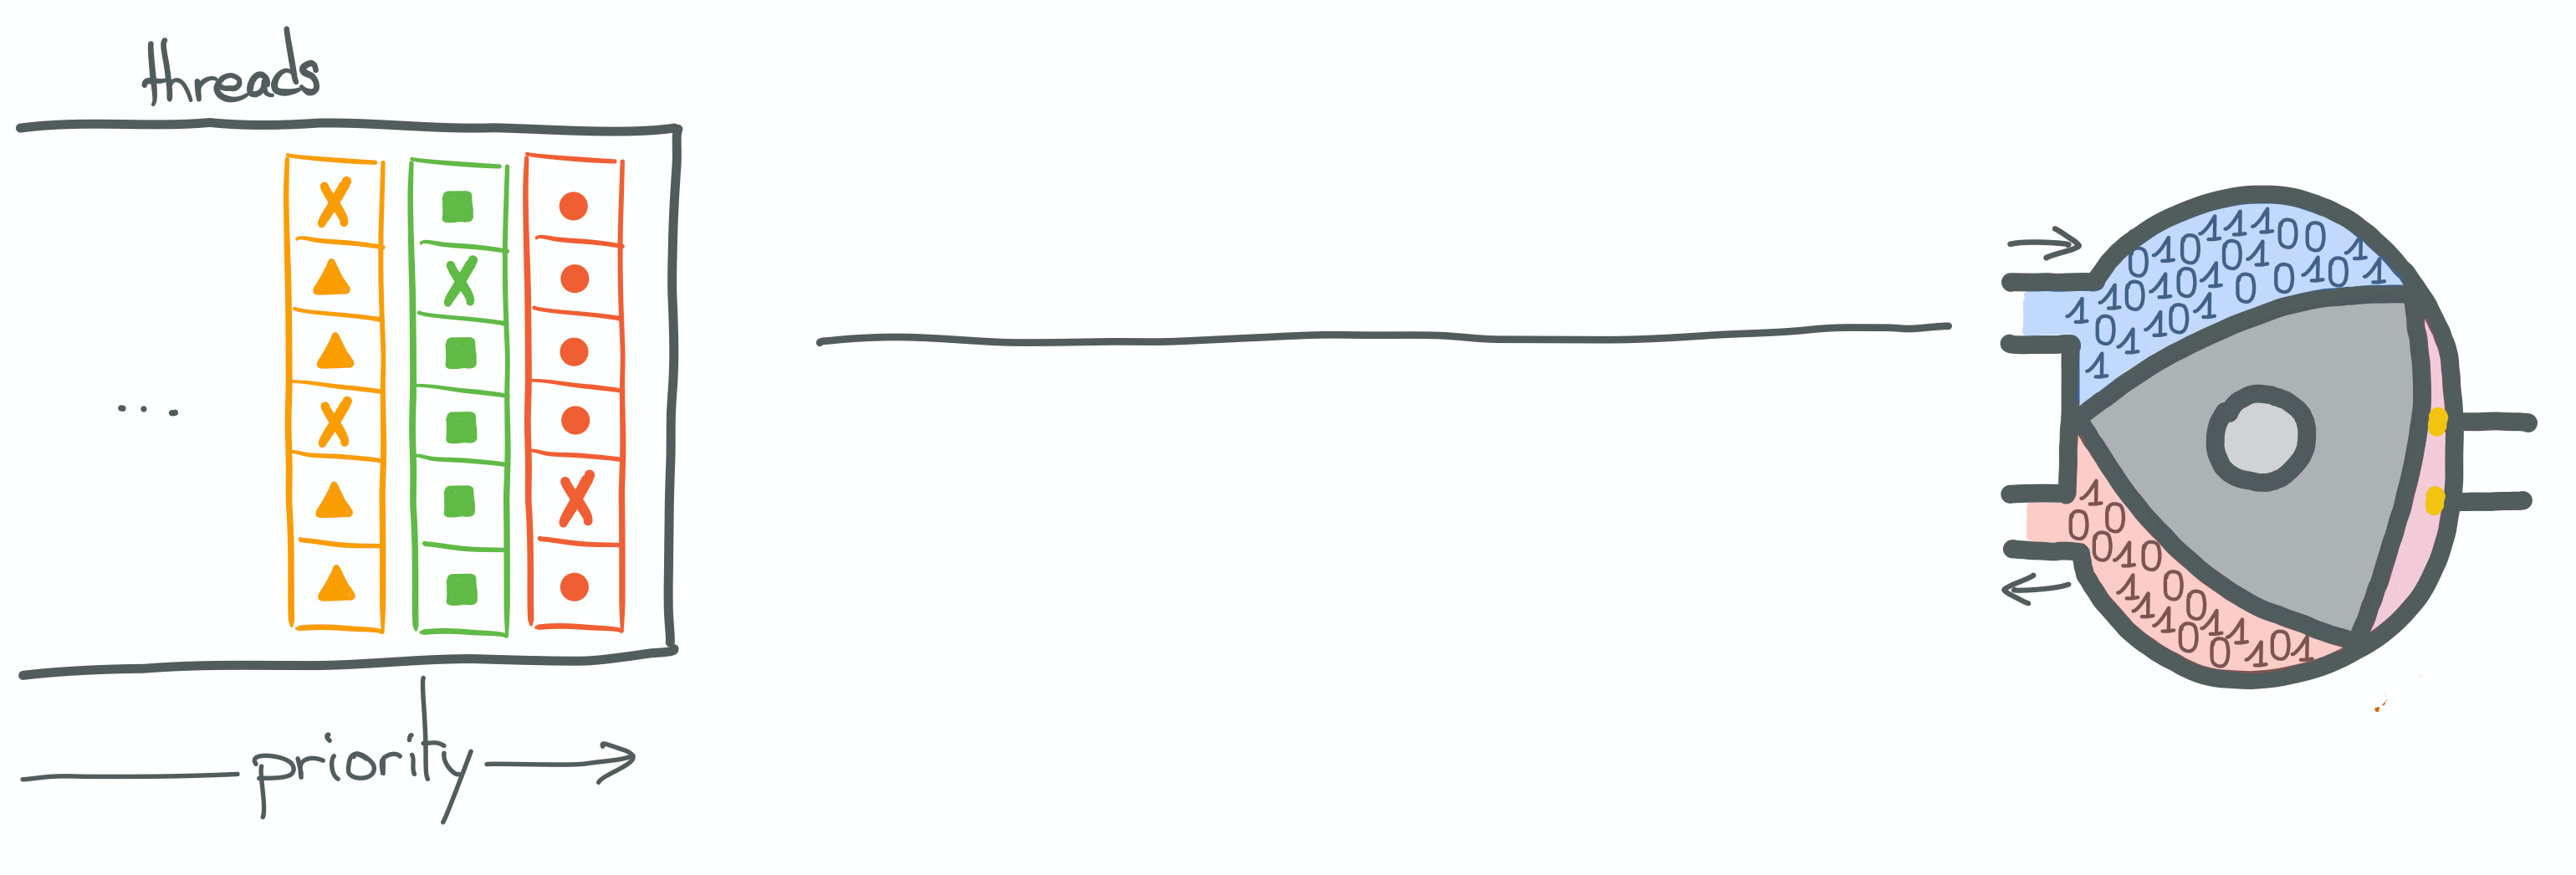
On the JVM, the threads we manipulate are actually kernel threads. The threads which are instantiated and managed by
the various flavors of ExecutorService, available via the helper java.util.concurrent.Executors, are an abstraction
over native threads, with additional thread pool logic, tasks queues management and scheduling mechanisms.
As said earlier, the executor I’ve used in this implementation is a “cached” ThreadPoolExecutor.
elasticServiceExecutor =
    Executors.newCachedThreadPool(new PrefixedThreadFactory("service"));
This executor handles an initial pool of threads, as well as a task queue (SynchronousQueue).
It also has a reference to a ThreadFactory, because this executor will try to match each Runnable, that is submitted
to it via its submit method, to a runnable thread in its pool. If no thread is available to run the next Runnable in
the queue, it will use the ThreadFactory to create a new thread and hand the Runnable object to it.
The threads thus created are managed by the kernel, which itself manages its own priority queue and acts according to its scheduling policy (we’ve talked about this in the [part 1 of this series][part-1]). The priority queue shown in the illustration above is the kernel’s.
So, in a nutshell, when a thread is scheduled to run, its instructions are executed one after the other by the CPU.
Up until it finishes, or a blocking call is made.
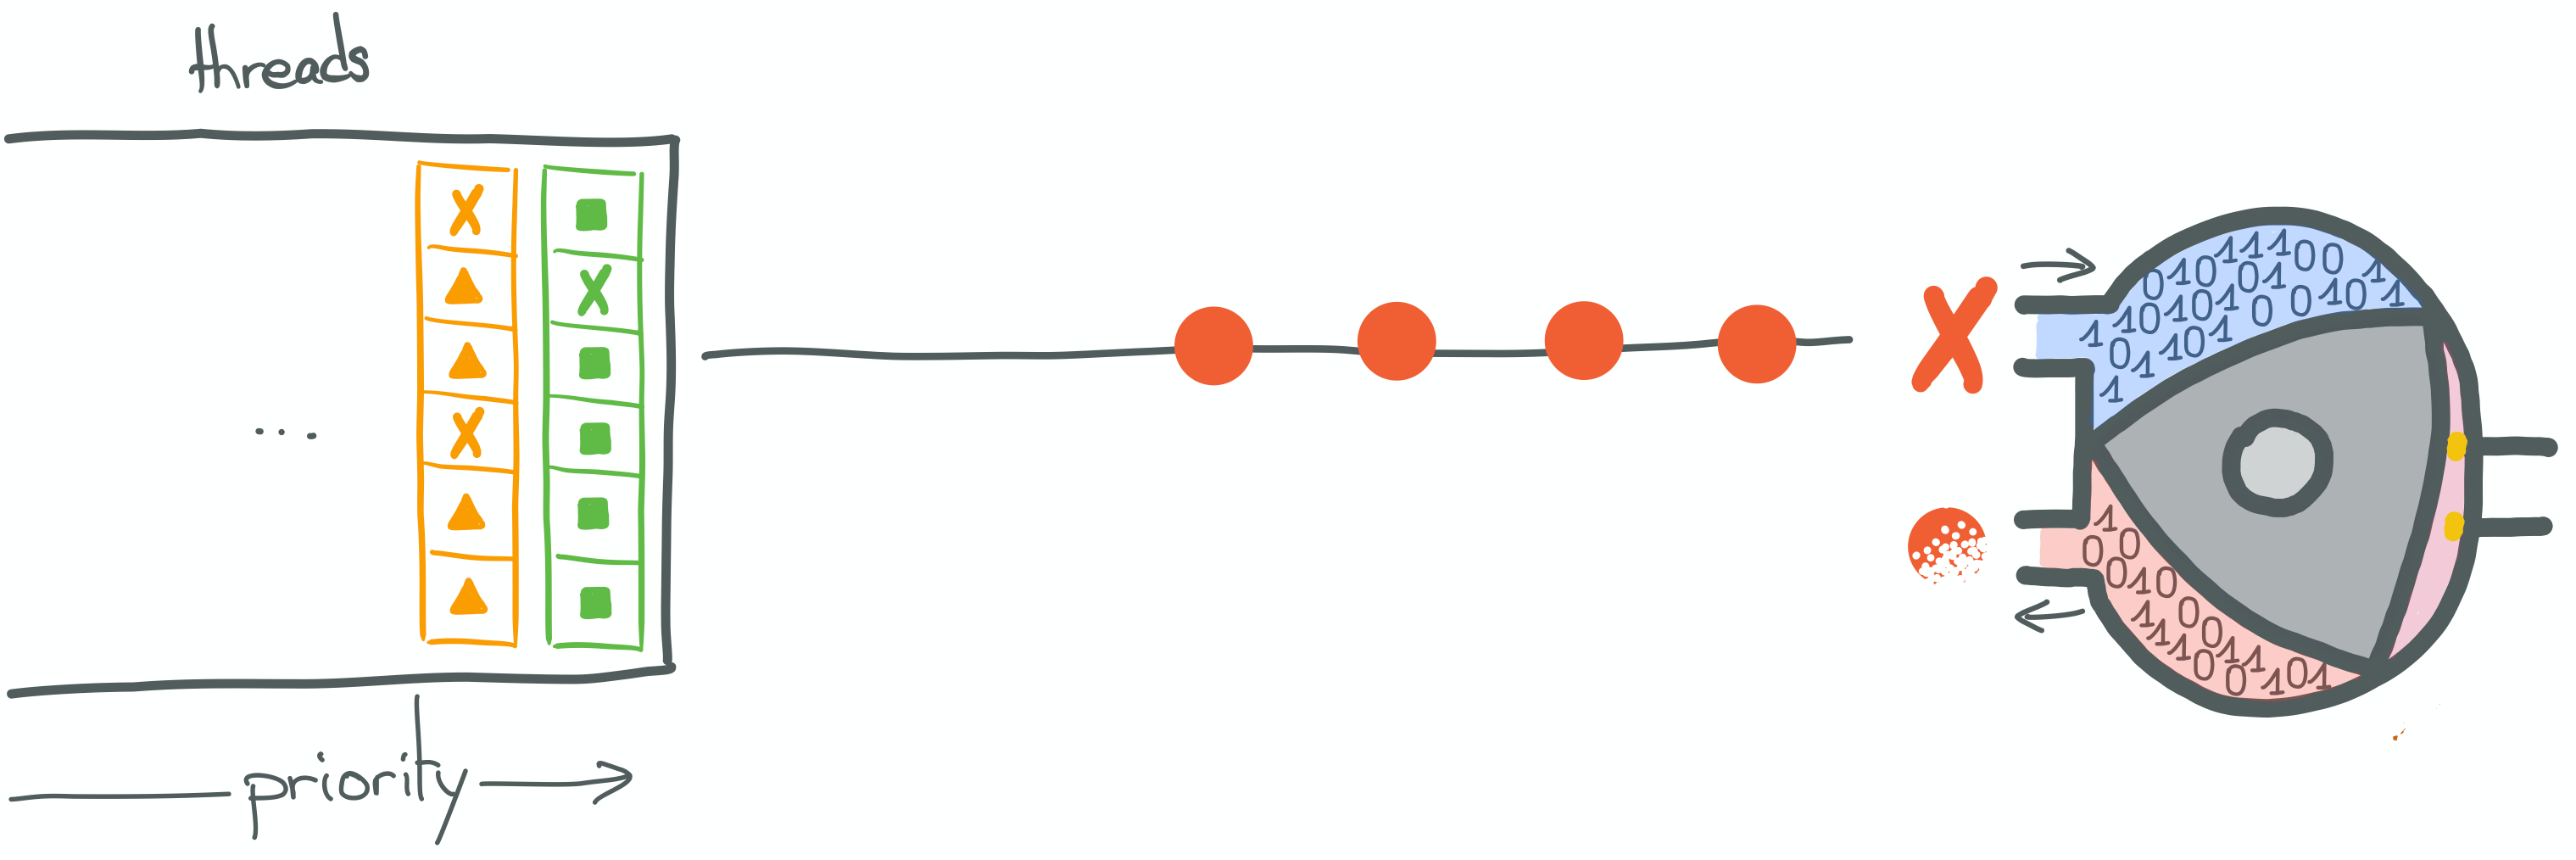
In the illustration above, the “round” instructions come from the currently scheduled thread. We can see that the
current instruction is, in fact, a blocking OS call (syscall, such as read).
What will actually happen here, is a context switch. Because the thread is currently trying to execute an action outside its current protection ring.
JVM applications run in user space (ring 3) to ensure memory and hardware protection.
The kernel runs in kernel space (ring 0). It is responsible to ensure computer security and that processes behave,
basically.
When executing syscalls, such as blocking reads, kernel space access level is required. Kernel instructions will be
run on behalf of the “user code” and will, for instance, ensure that this thread does not hold onto the CPU while
waiting for its call to return and that another thread has a chance to run in the mean time, hence ensuring compliance
with the scheduling policies.
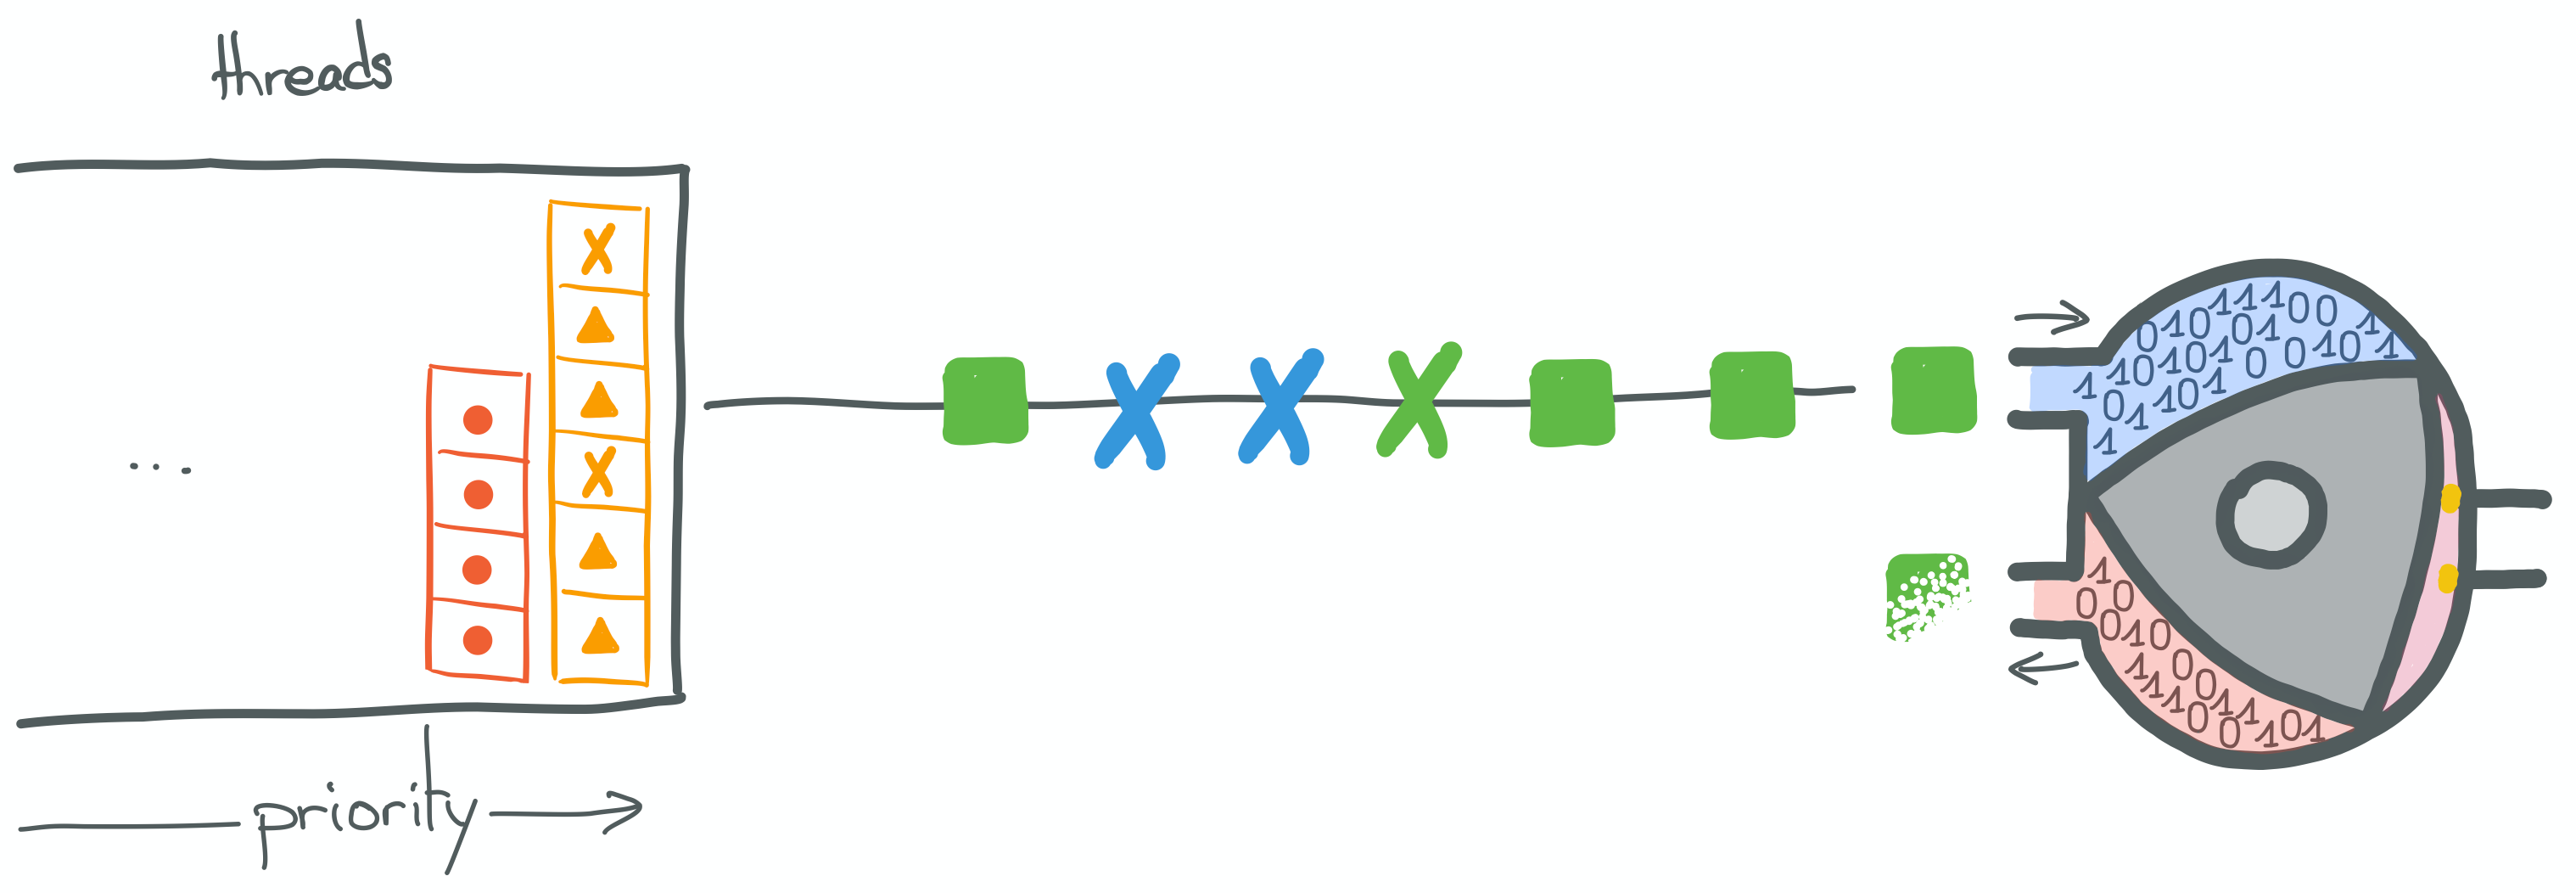
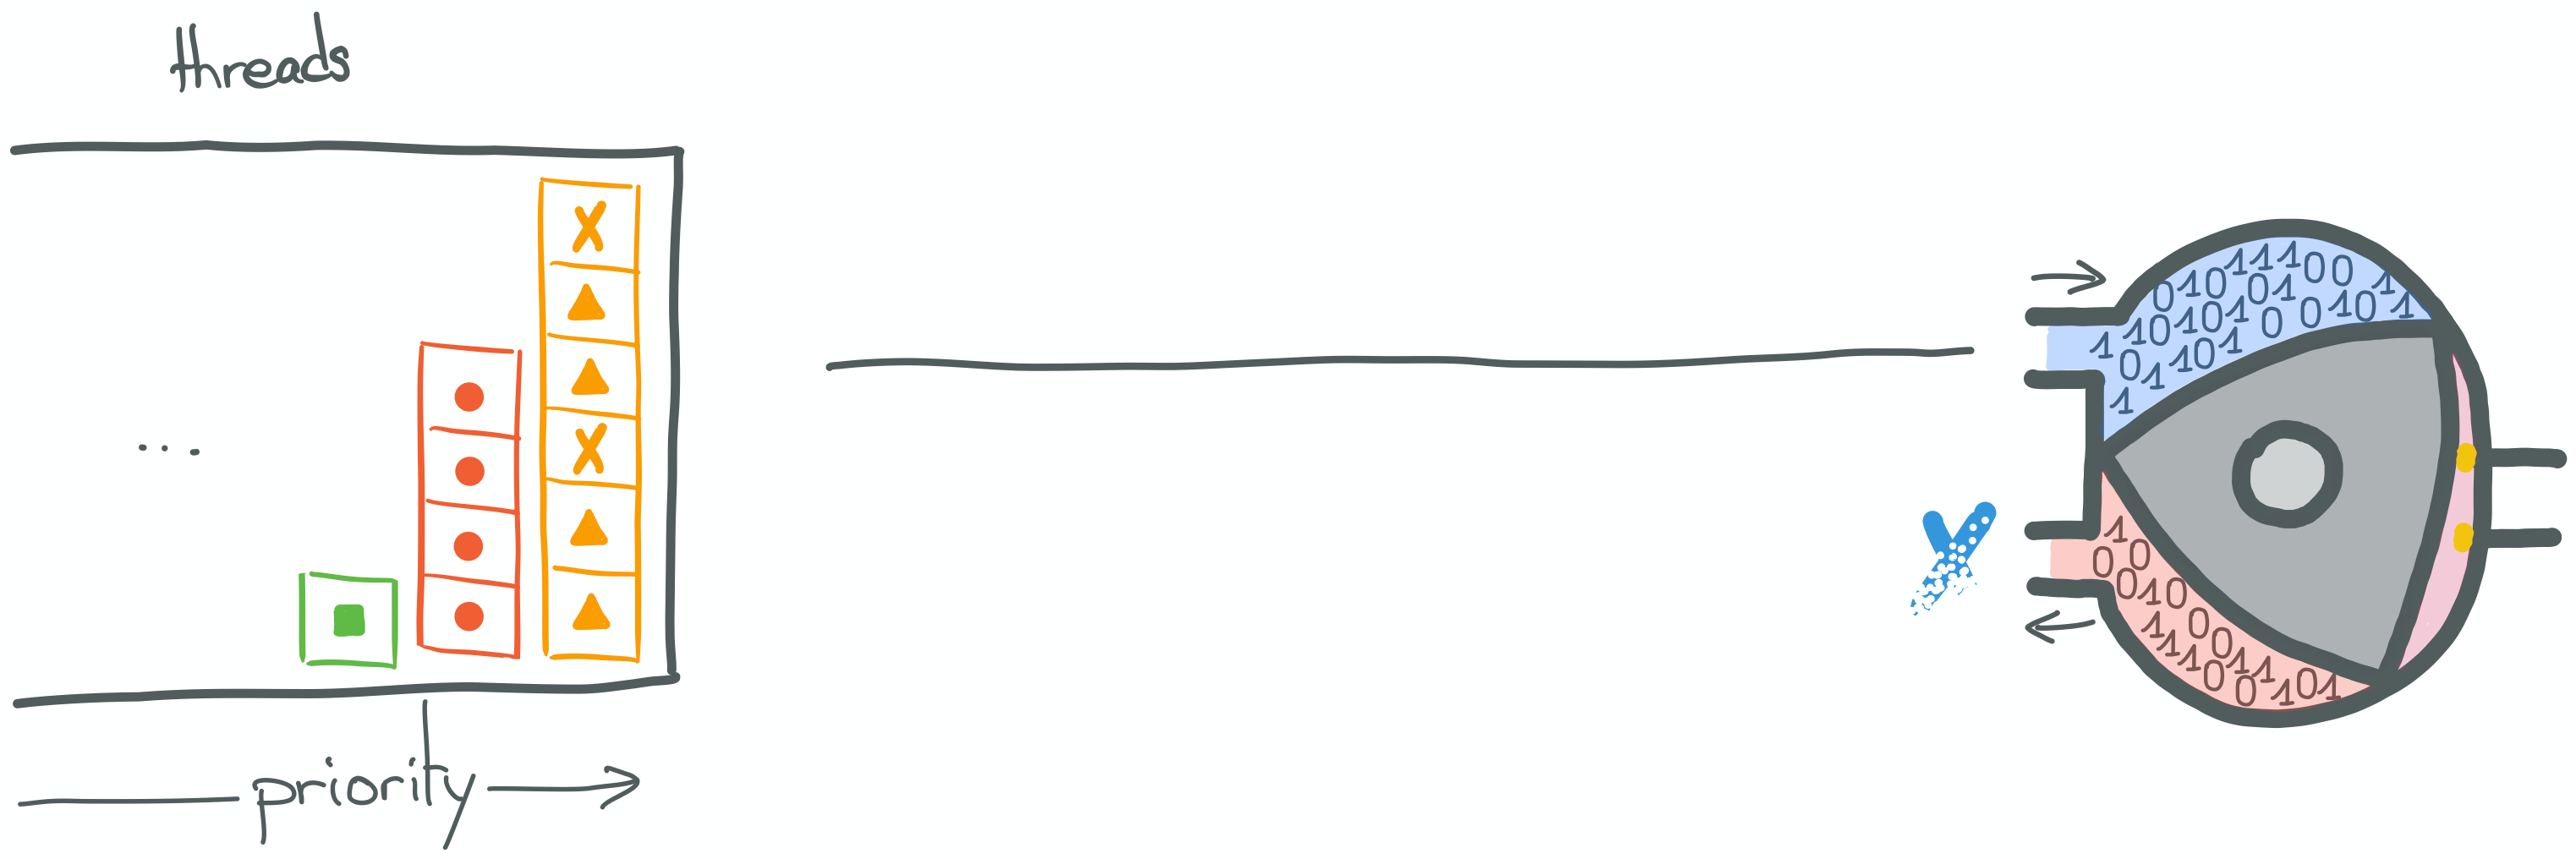
For the sake of simplicity, I’m representing a context switch as a 2-step process.
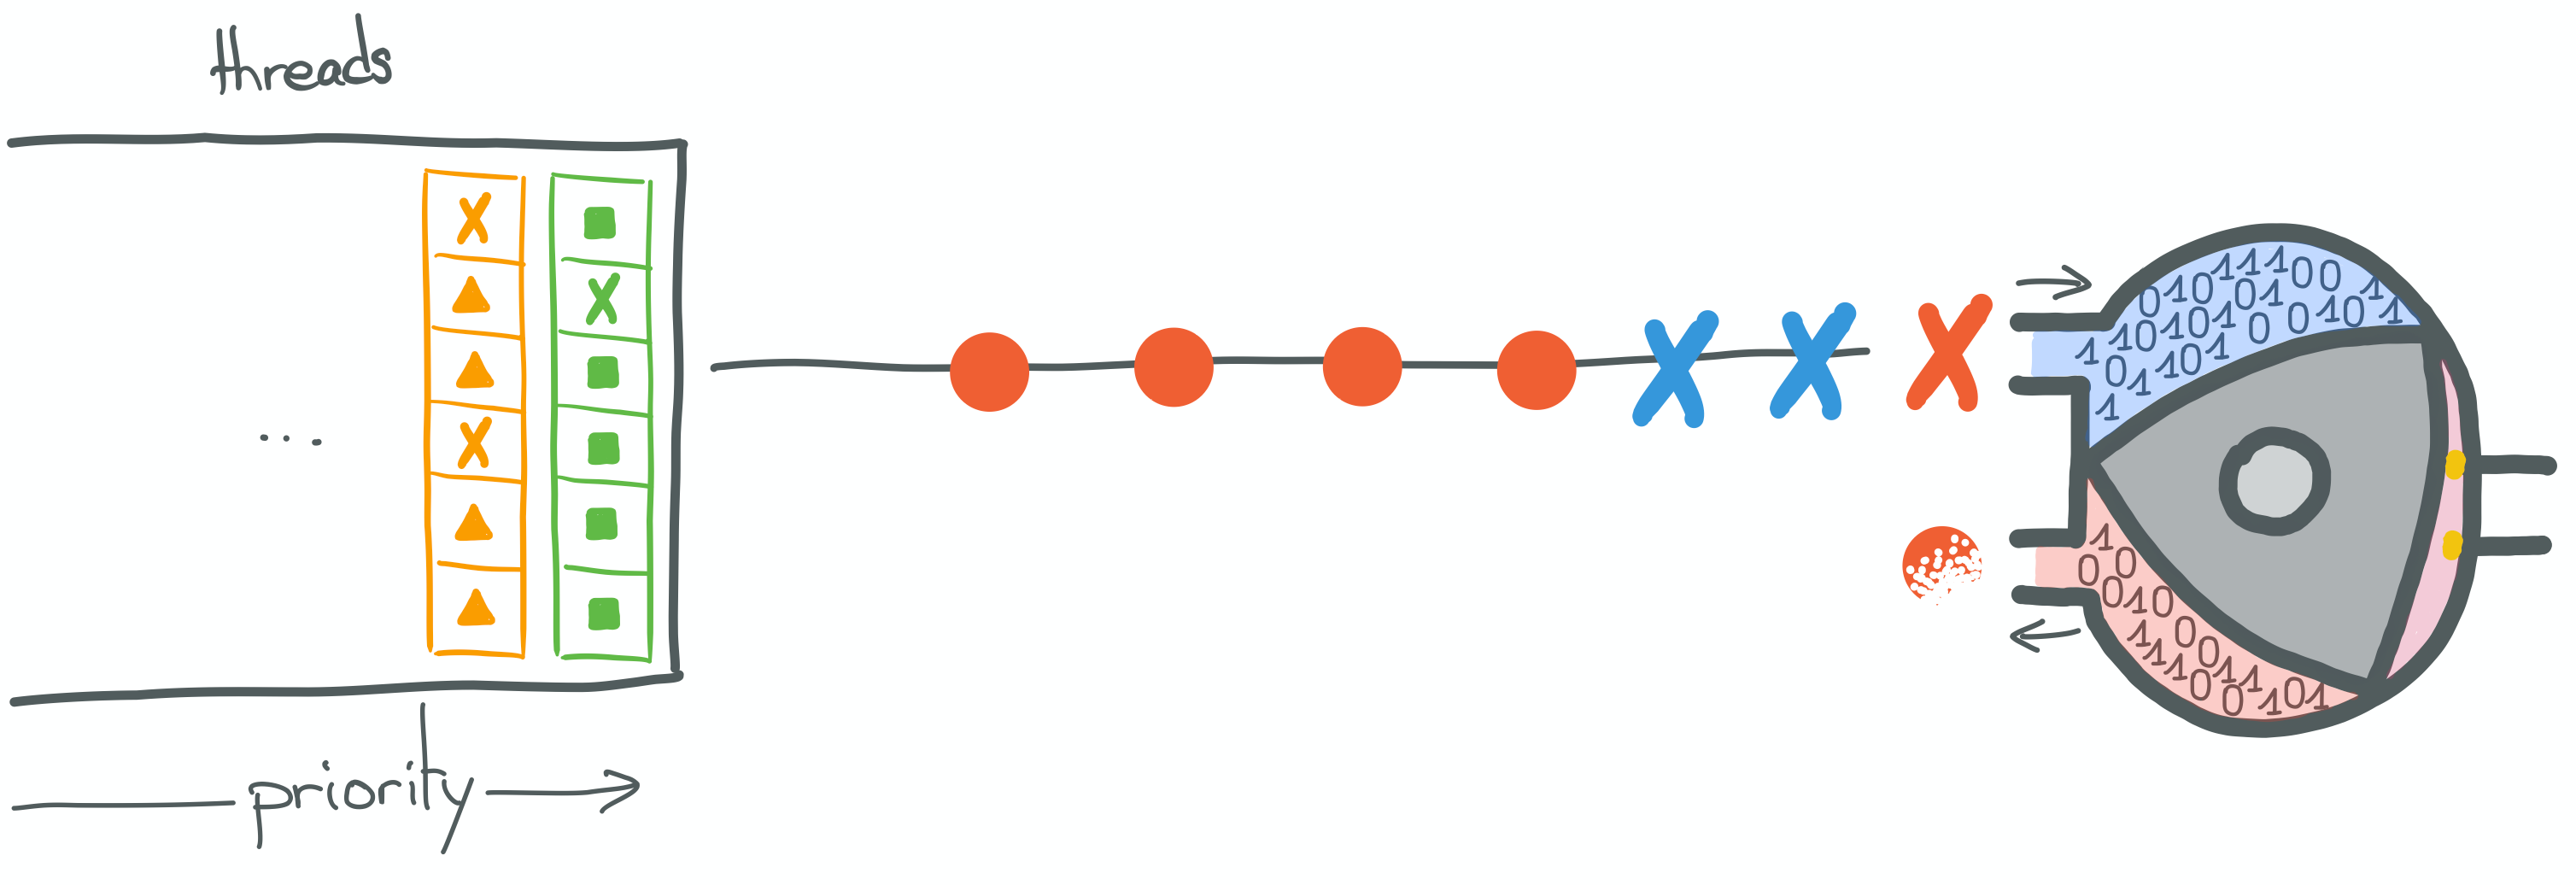
During the first step, the kernel is going to suspend the execution of the current thread. In order to do this, it is going to save a few things, such as the current instruction or process counter (on which instruction did the thread pause), the thread’s current call stack, the state of CPU registers it was accessing, etc.
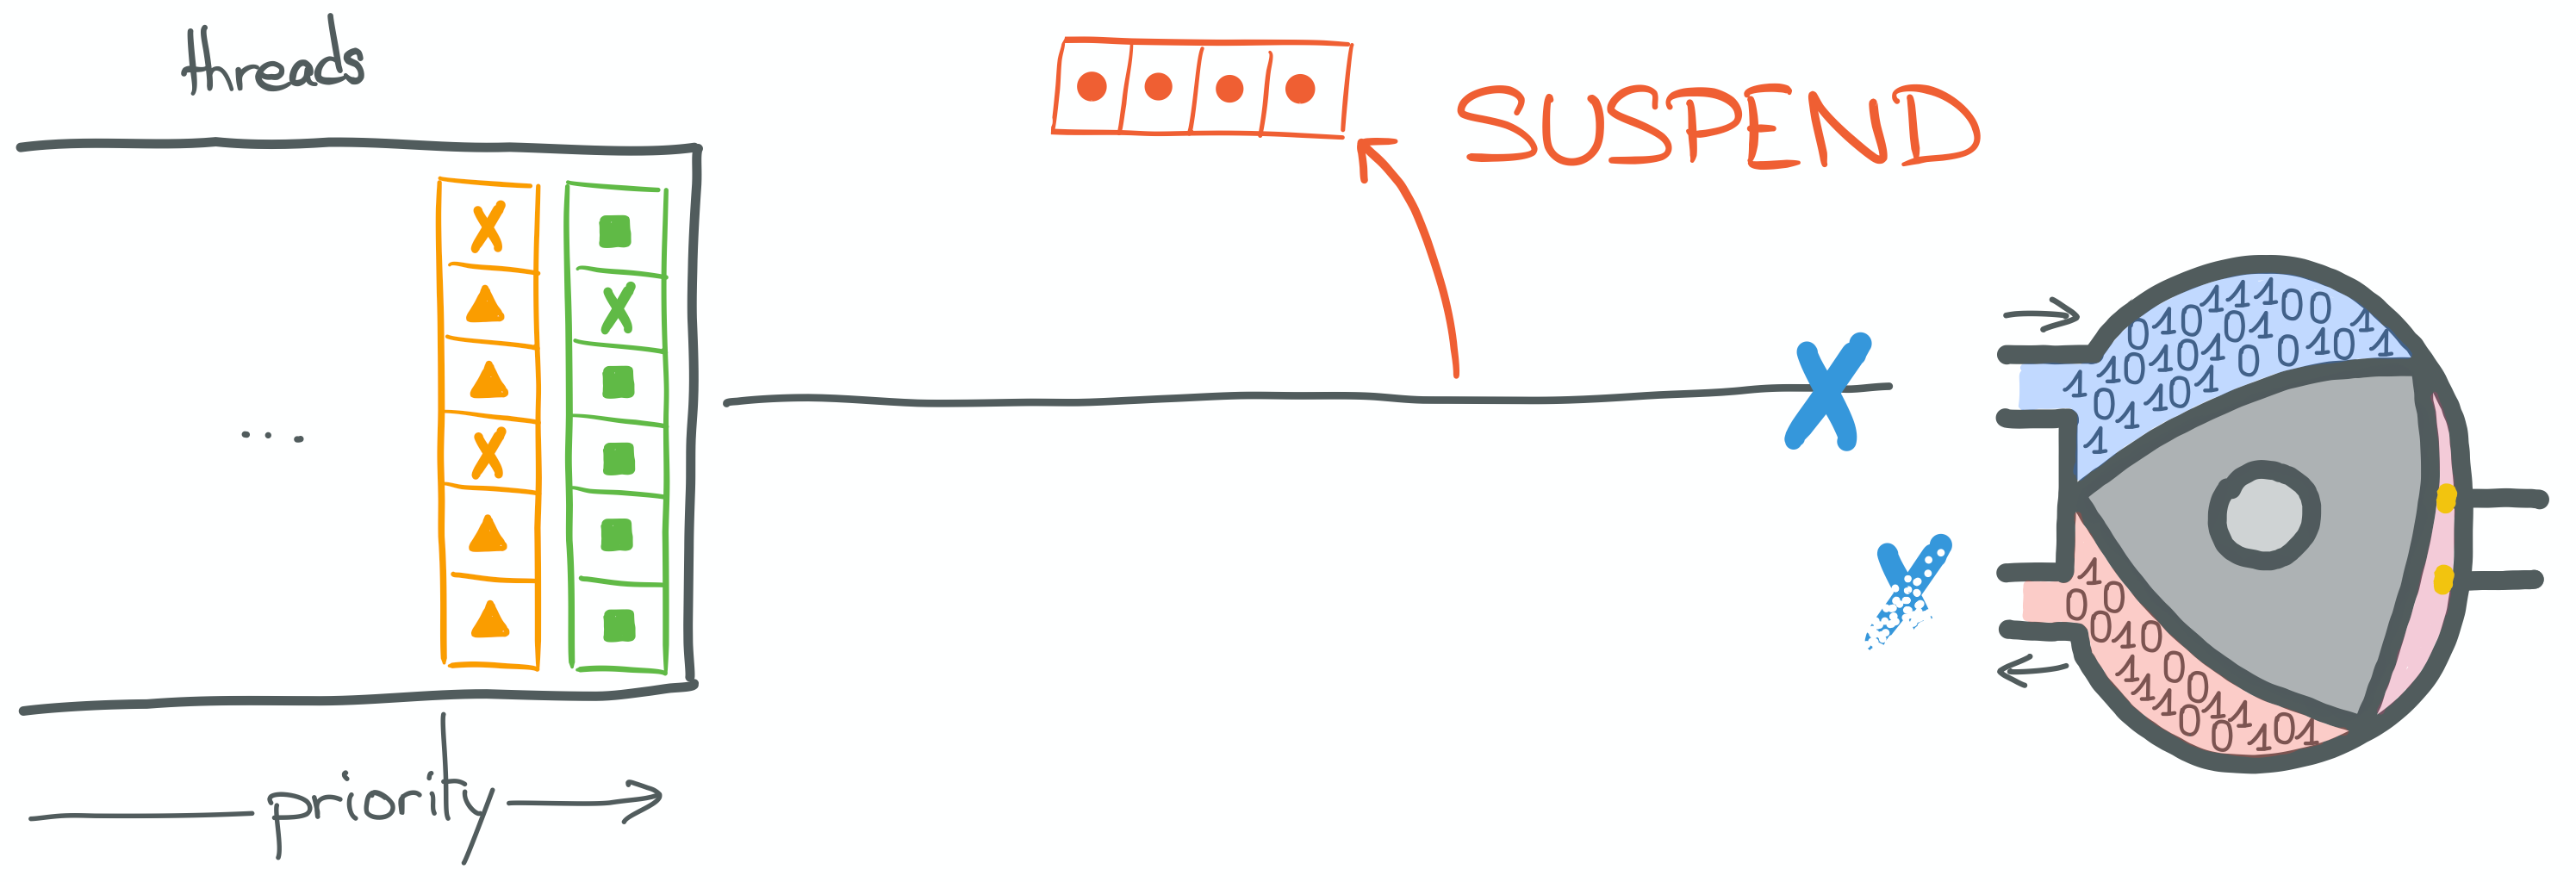
The kernel is going to save all this in a data structure (see PCB, for Process Control Block), and put the thread back into the priority queue.
Also for the sake of simplicity, I am representing the “not ready” state of a thread as if flagged and put back into a priority queue. But the actual logic may be more complicated, including several distinct queues for different “waiting” purposes or any arbitrary logic as kernel developers see fit.
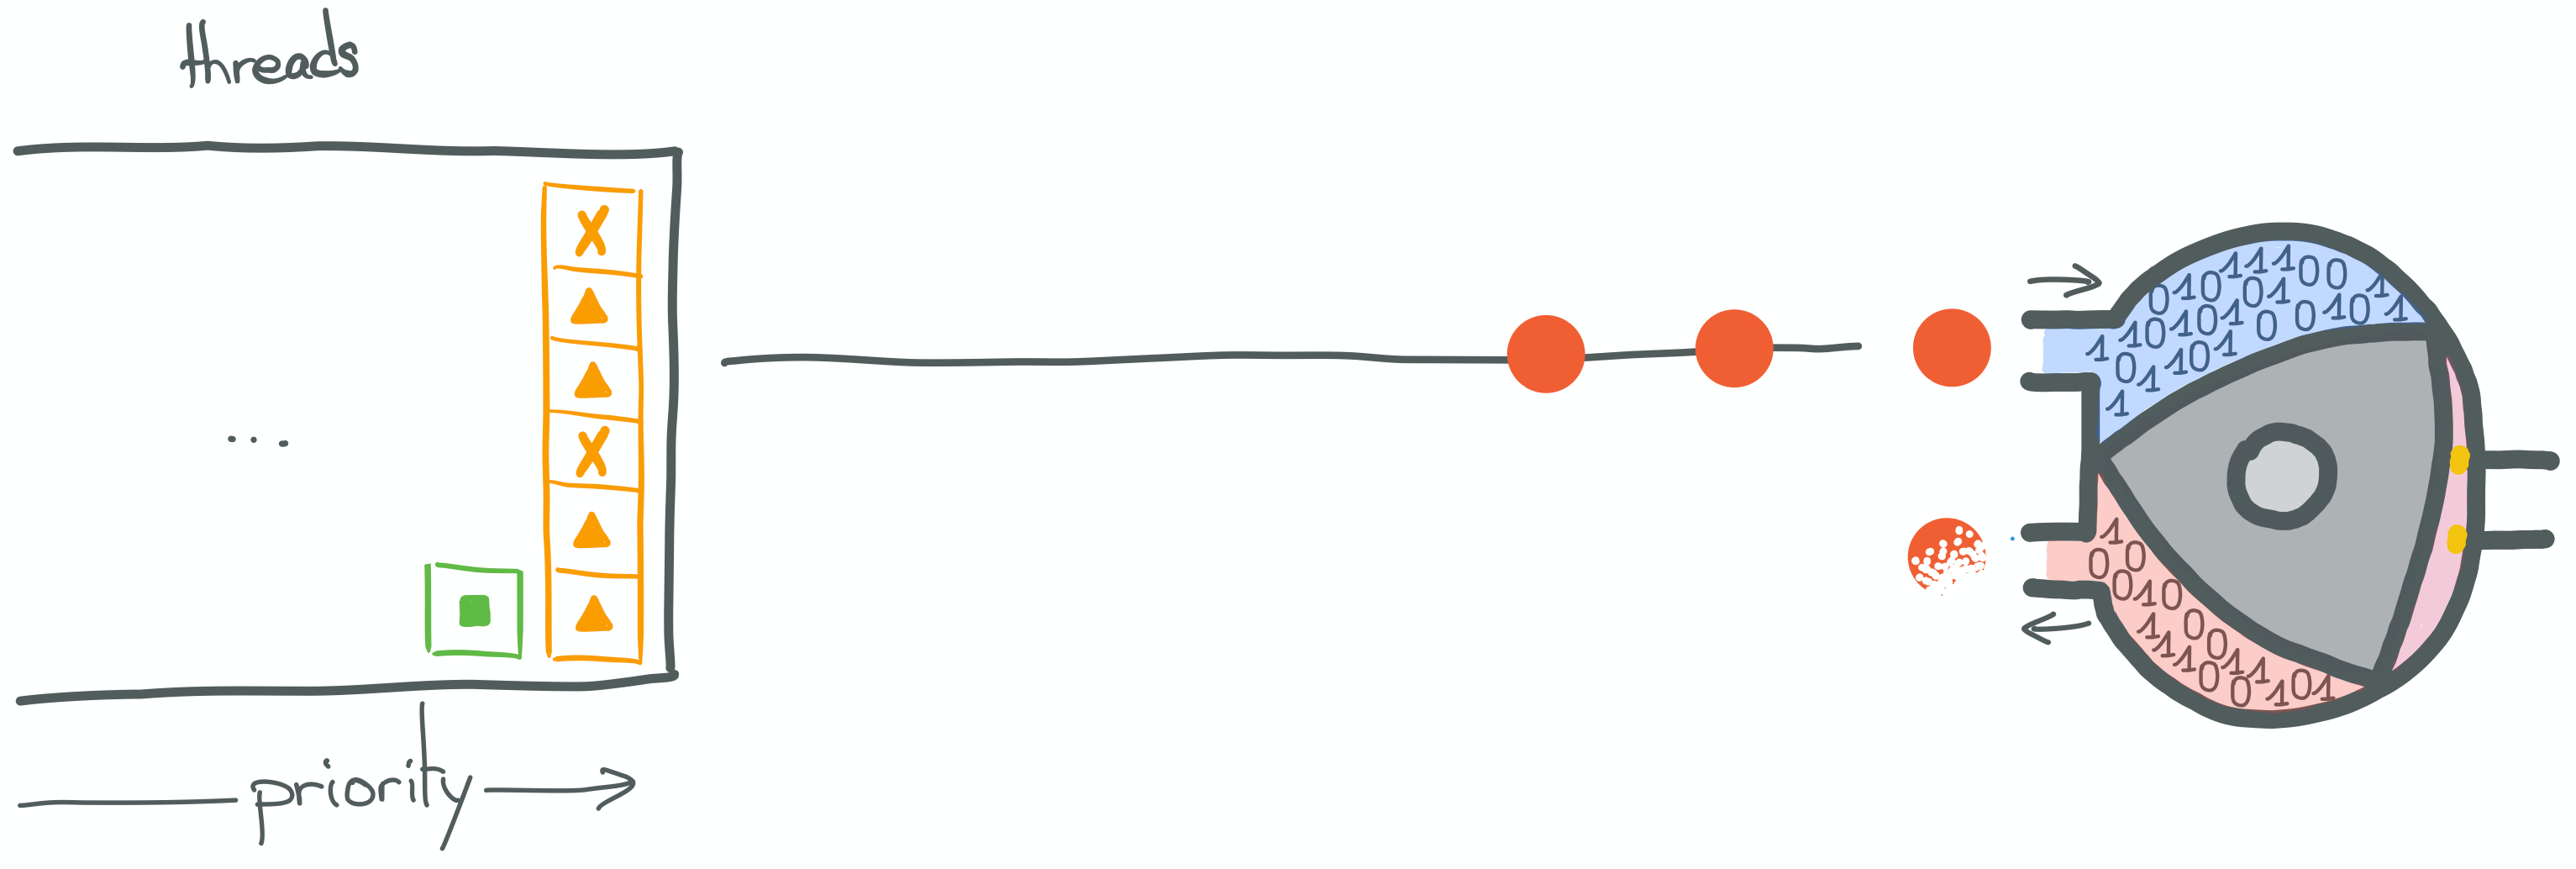
In the second step, the kernel decides which thread should be scheduled next, according to its policies, and this thread is allocated to the CPU. If this thread had been scheduled before, its state would have to be restored first.
This thread itself may contain instructions pointing at a blocking syscall, which would trigger a new context switch, and so on and so forth until eventually the result of the blocking syscall made by the round instruction above is available and this thread is scheduled again.

Now it’s time to connect the dots and understand why blocking calls deserve such hatred.
Why they are bad
One of the blog posts I like the most to explain this issue is “Little’s Law, Scalability and Fault Tolerance: The OS is your bottleneck (and what you can do about it)” by @pressron.

I’m trying to do half as good in this series, so I strongly suggest that you take a look at it and read at least the first 3 parts of the article: “Our Little Service”, “Little’s Law” and “What Dominates the Capacity”.
It explains that the number of connections our services can handle, when executing blocking code, is
not limited by the number of network connections our OS can keep open, but by the number of threads we create.
Each kernel thread stack takes memory space and thread scheduling (context switches explained above) wastes CPU cycles,
induce CPU cache misses and adds latency to requests.
Allowing the software to spawn thread willy-nilly may bring our application to its knees, so we usually set a hard limit on the number of threads we let the application spawn.
— R. Pressler
So we know that we can’t let the number of threads grow too much.
But why is this code creating one thread-per-connection (not to mention the additional “pulsing” thread)?
The answer is: because of the cached ThreadPoolExecutor!
As I said:
If no thread is available to run the next Runnable in the queue, it will use the ThreadFactory to create a new thread and hand the Runnable object to it.
In this implementation, each request issues blocking writes and reads to and from the SocketChannel.
Each of these calls lead to context switches during which the current thread will be paused.
So connection requests added to the ThreadPoolExecutor waiting queue will quickly drain the number of threads
cached in the pool, because they are paused!
This triggers the creation of more threads by the executor and boom!
We could use a different executor, such as Executors.newFixedThreadPool(int, ThreadFactory) in order to “limit the
number of threads we let the application spawn”. By doing so we explicitly limit the number of connections our service
can handle.
We could, of course, buy more servers, but those cost money and incur many other hidden costs. We might be particularly reluctant to buy extra servers when we realize that software is the problem, and those servers we already have are under-utilized.
— R. Pressler
Conclusion
This part of the series presented a use case from which we can build upon and experiment. The goal is to find acceptable solutions to blocking calls and scalability issues.
I hope you understand a little more about blocking calls and context switches after reading this.
In the next part, we will take a look at asynchronous calls.

